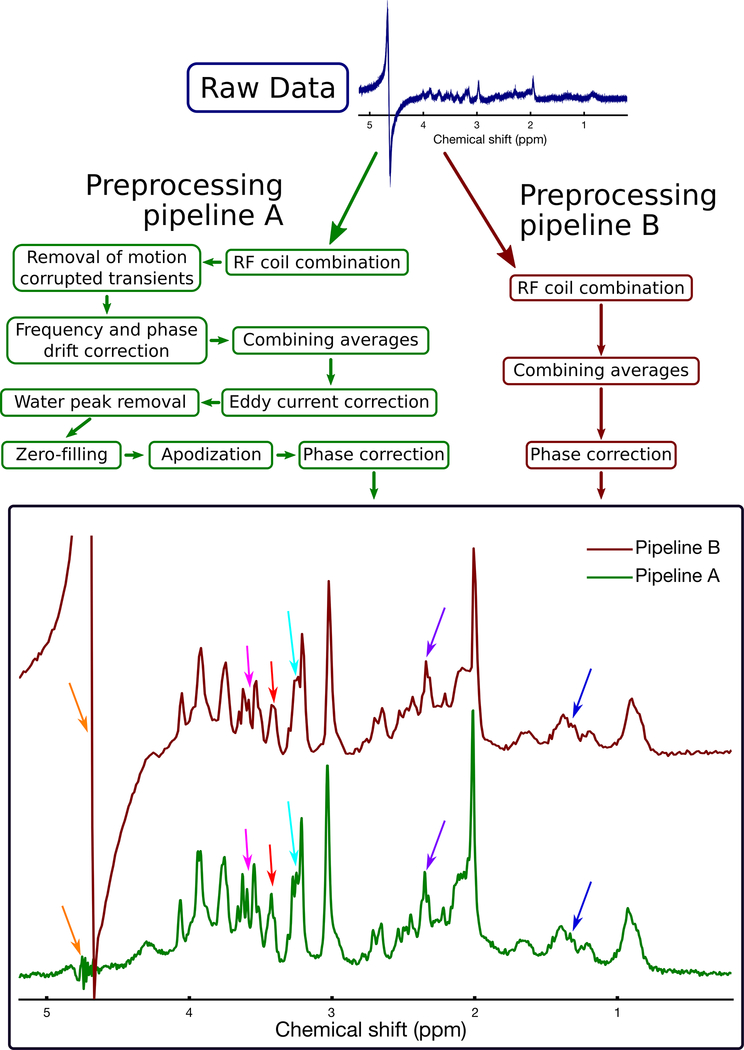
Figure 4.
Illustration of two example processing pipelines, applied to the same raw data. The dataset was obtained from a rat brain using the PRESS sequence at 7 T with TE=11 ms. Processing pipeline B (dark red boxes, right side) includes only basic steps to combine the coils and transients (similar to the standard processing pipeline provided by clinical scanner vendors). Processing pipeline A (green boxes, left side) involves additional steps to remove motion corrupted averages, to retrospectively correct frequency and phase drift, and to remove eddy current artefacts. Pipeline A resulted in several noticeable improvements in spectral quality, including reduced water contamination (orange arrows), and improved visual definition of most spectral peaks, including lactate (1.3 ppm, dark blue arrows), glutamate-H4 (2.3 ppm, purple arrows), tCho (3.2 ppm, light blue arrows), taurine (3.4 ppm, red arrows), and myo-inositol (3.5 ppm, pink arrows). These improvements highlight the importance of using an appropriate processing pipeline. Note that as stated in the recommendations tables, zero-filling and apodization may be used to improve the visual appearance of the spectrum, but should not be performed prior to spectral analysis.

