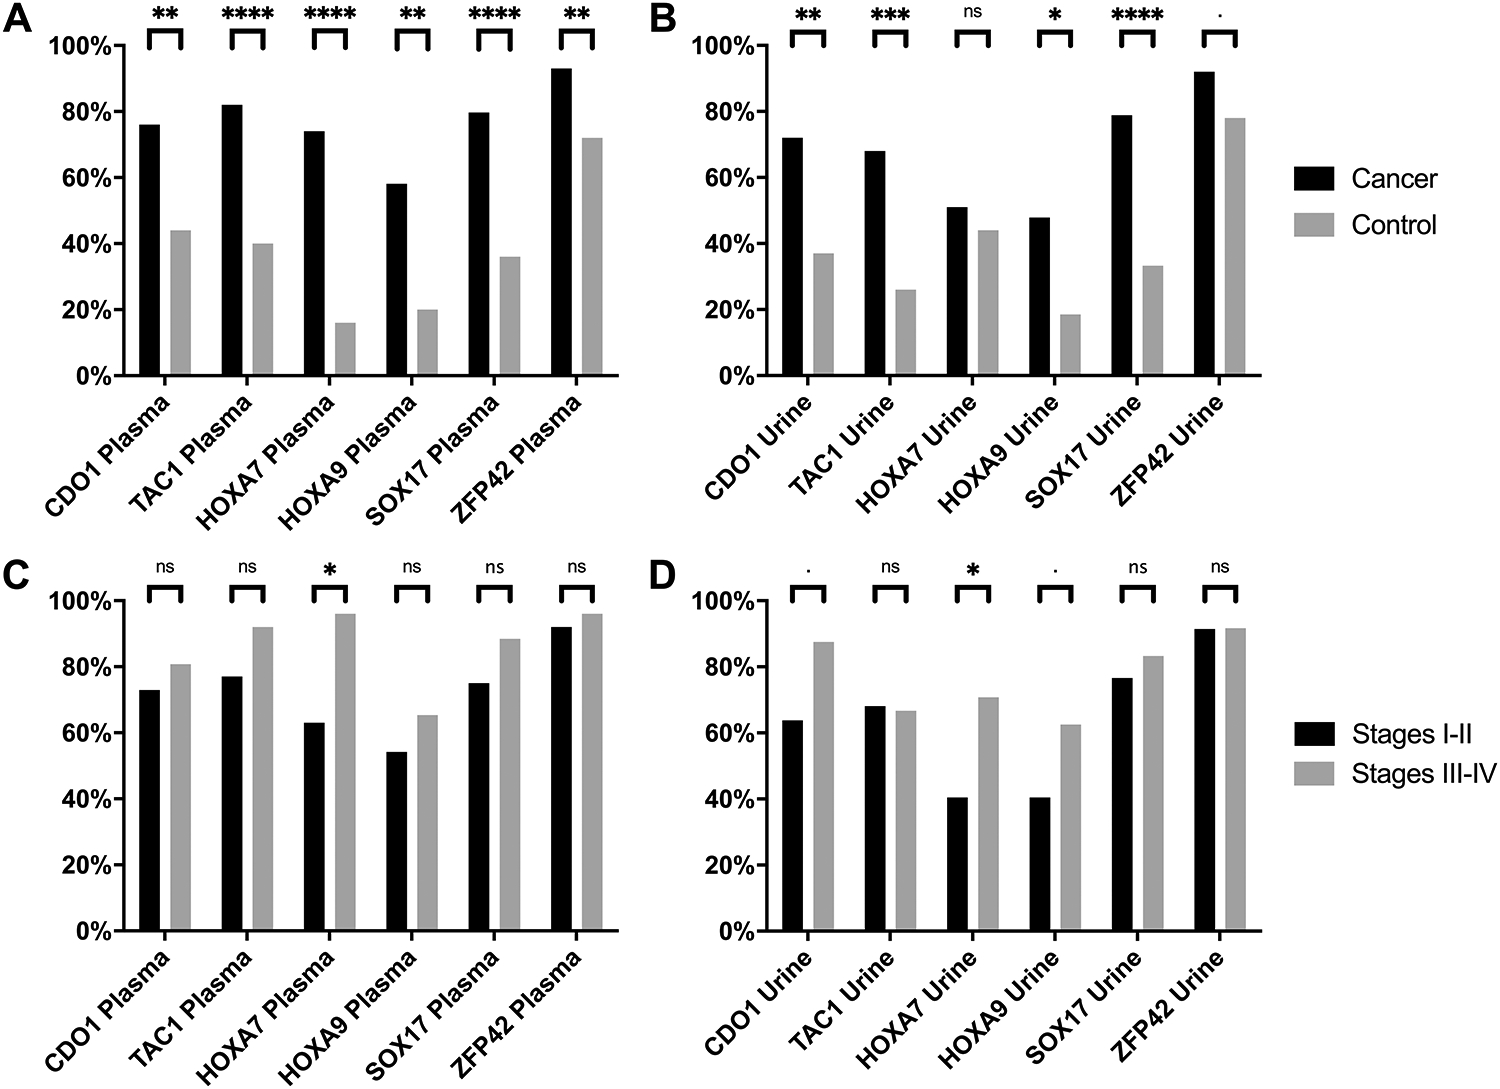
Figure 2. Methylation Detection Frequency in plasma and urine, comparing patients with NSCLC vs controls and early stages (I-II) vs late stages (III-IV).

This bar plot shows the percentage of positive methylation detected in plasma (A& C) and urine (B & D) comparing NSCLC patients (black) vs controls (grey) in A and B and comparing NSCLC early stage NSCLC patients (black) vs late stage NSCLC patients (grey) in C and D. Significance values: ‘****’ p < 0.0001; ‘***’ p <0.001: ‘**’p < 0.01: ‘*’p <0.05: ‘.’p <0.1; ‘NS’ non-significant (p>0.1). Source data can be found in Table 2 and supplementary tables S4 and S5 respectively, where “n” is the number of samples positive for methylation detection in cancer and controls in plasma and urine.
