
Figure 3: c-ABL plays a role in cetuximab resistance.
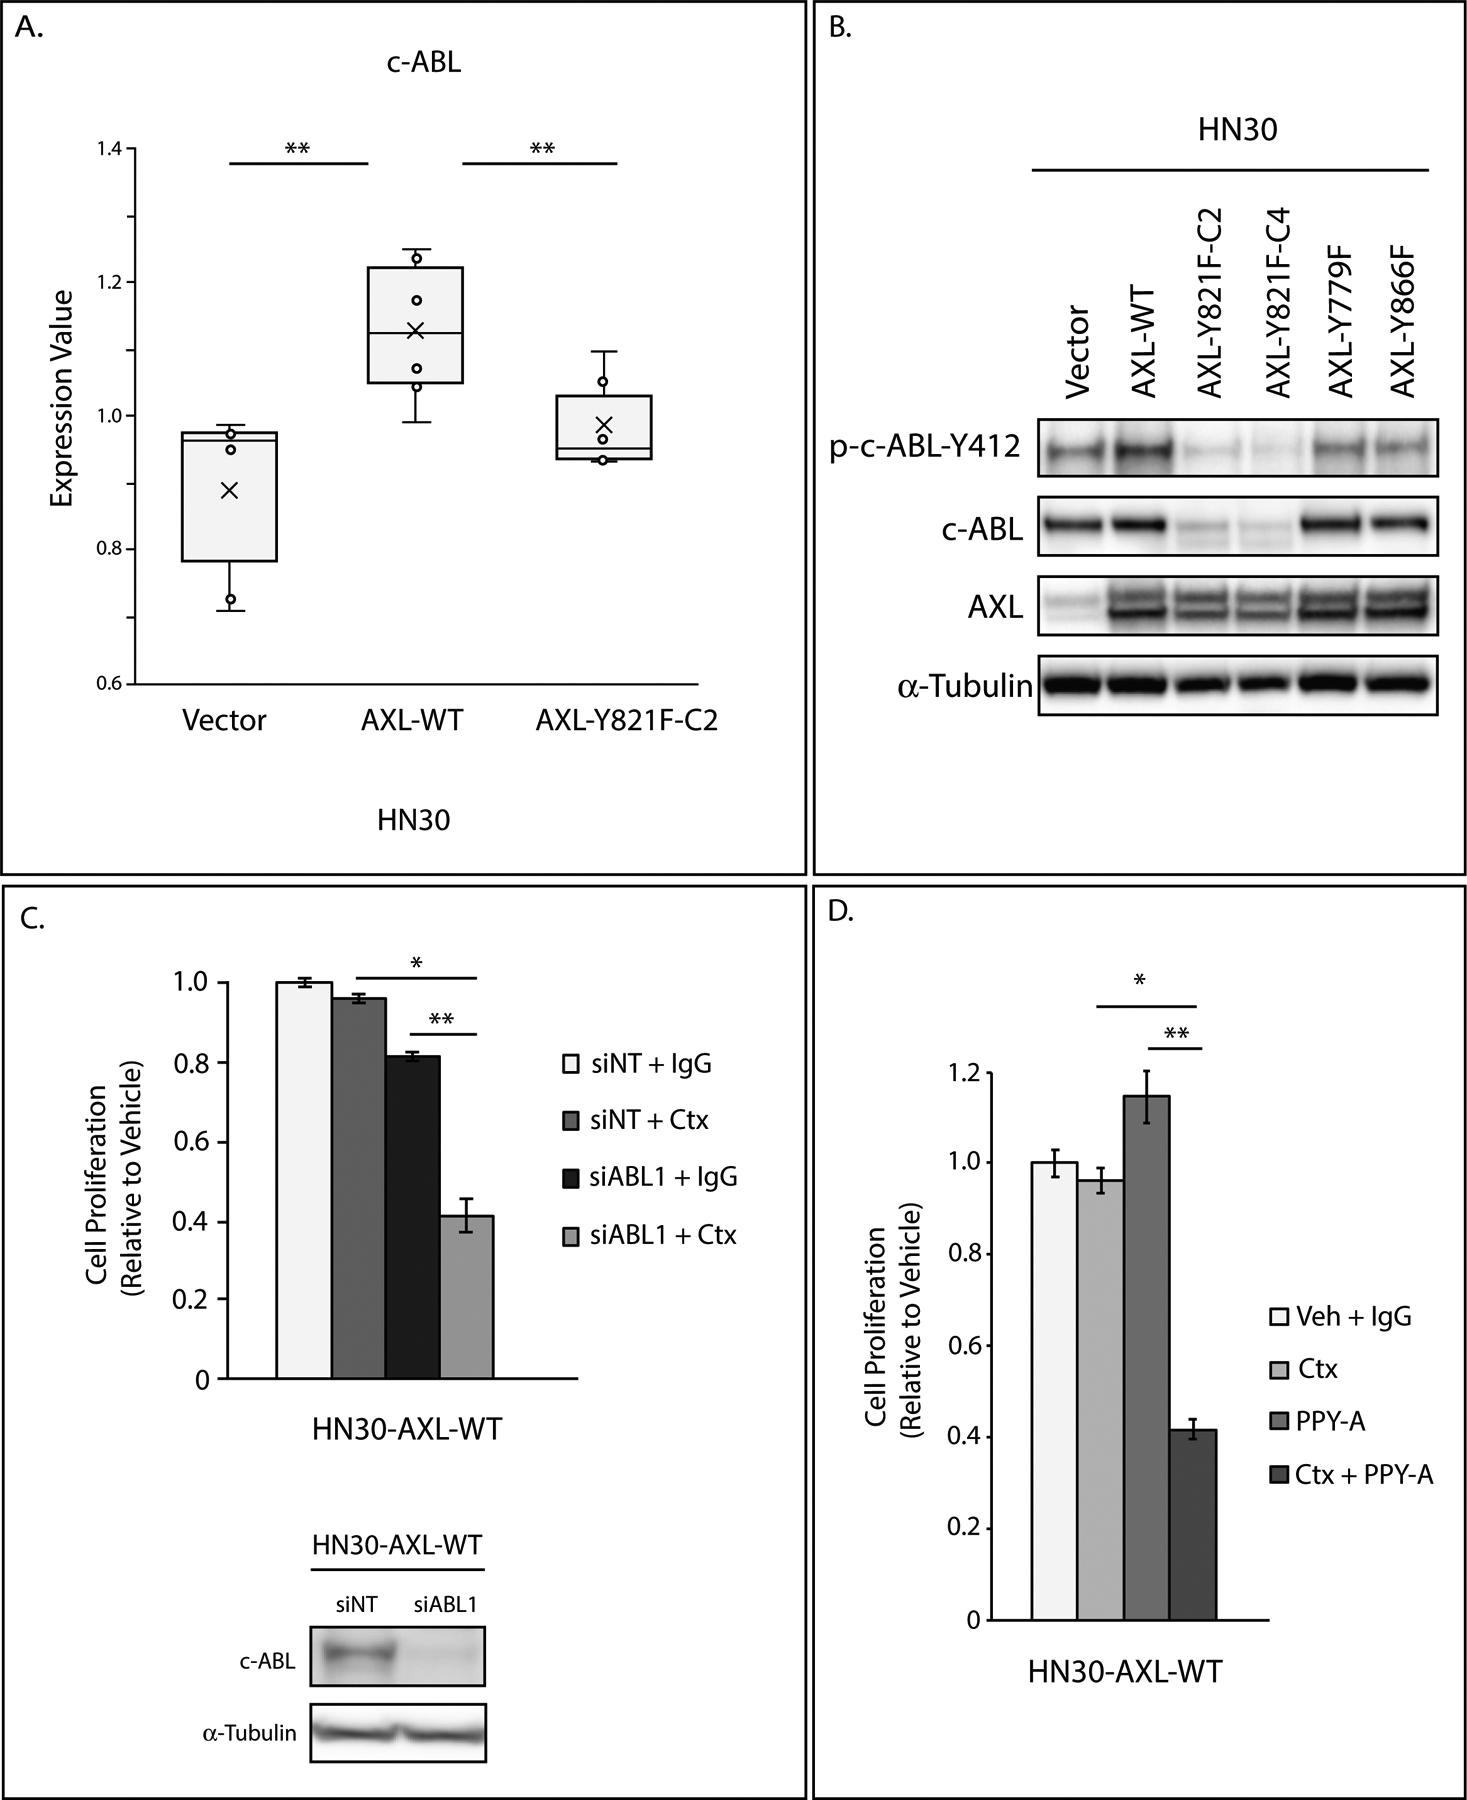
A: Lysate of HN30-Vector, HN30-AXL-WT, and HN30-AXL-Y821F(clone 2) cells were analyzed via RPPA. Expression values of c-ABL are presented in box plot format. Mean, SEs, and student’s t-test were calculated based on 3 replicates from two experiments. **, P<.01.
B: Endogenous phospho-c-ABL-Y412, c-ABL, and AXL expression were determined by immunoblot analysis of cell lysates from HN30-Vector, HN30-AXL-WT, and HN30-AXL mutants (Y779F, Y821F, Y866F) with α-tubulin as loading control.
C: HN30-AXL-WT cells were transfected with siABL1 or nontargeting siRNA (siNT). 24 hours later, cells were treated with IgG or cetuximab (100nM), and after 72 hours of treatment, relative cell numbers were determined by crystal violet assay. Mean values and SEs were derived from replicates within one experiment. Statistical analyses are representative of three independent experiments. *, P<.05; **, P<.01. siABL1 knockdown of c-ABL was evaluated by immunoblot analysis of cell lysates with α-tubulin as loading control.
D: HN30-AXL-WT cells were treated with DMSO and IgG, cetuximab (100nM), PPY-A (500nM), or combination of cetuximab and PPY-A for 72 hours and relative cell numbers were determined by crystal violet assay. Mean values and SEs were derived from replicates within one experiment. Statistical analyses are representative of five independent experiments. *, P<.05; **, P<.01.