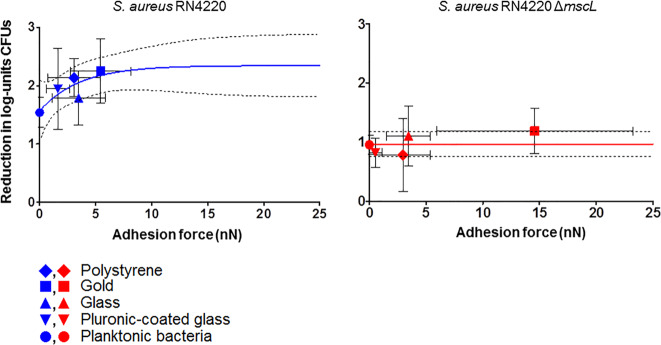
Fig. 3. Staphylococcal uptake of dihydrostreptomycin.
Reduction in CFUs (log mL−1) of planktonic and adhering staphylococci after 2 h exposure to dihydrostreptomycin, expressed relative to exposure to PBS, as a function of adhesion force. Lines indicate an exponential fit used to derive plateau levels and critical adhesion forces. Dashed lines indicate the 95% confidence band. Horizontal error bars represent standard deviations over at least 45 force–distance curves, for one probe comprising three different spots recording five force–distance curves on each spot. Three probes prepared from three separate bacterial cultures. Vertical error bars represent standard deviations over three measurements from three different bacterial cultures.

