Figure 7.
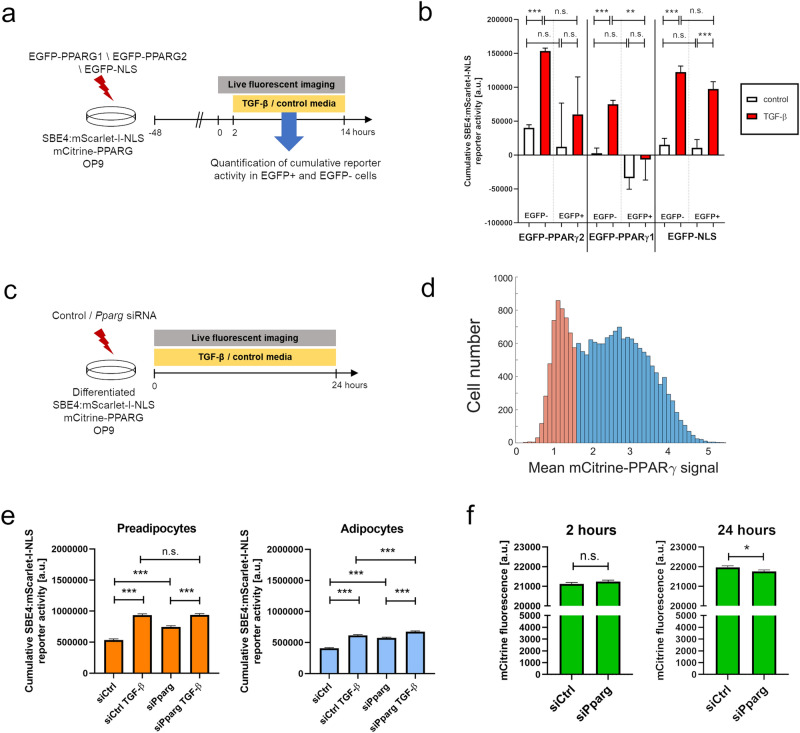
PPARγ inhibits TGF-β signaling in mCitrine-PPARG SBE4:mScarlet-I-NLS OP9 cells. (a) Outline of the method used to quantify TGF-β signaling activation depending on the overexpression of custom constructs. To prevent basal differentiation, cells were kept below 50% of confluence throughout the experiment. (b) Quantification of cumulative SBE4:mScarlet-I-NLS activity at the single-cell level during 12 h after TGF-β stimulation in transfected (EGFP +) and control untransfected (EGFP-) cells in the same wells. Results of one experiment representative for three independent experiments. (c) Outline of the method used to quantify TGF-β signaling activity depending on Pparg knock-down. SBE4:mScarlet-I-NLS mCitrine-PPARG cells were differentiated, followed by transfection with either Pparg siRNA or control non-targeting siRNA. (d) mCitrine-PPARG expression at the beginning of imaging was used to classify cells as either preadipocytes (orange) or adipocytes (blue). (e) Quantification of cumulative SBE4:mScarlet-I-NLS activity at the single-cell level during 24 h after siRNA transfection in preadipocytes and adipocytes. Ordinary one-way ANOVA with Sidak’s multiple comparisons test. (f) Determination of siRNA efficiency by the quantification of mCitrine-PPARG expression at 2 h and 24 h in all cells treated with Pparg siRNA or control non-targeting siRNA. Two-tailed Student t-tests. **p < 0.01; ***p < 0.001, n.s.—not significant. Average + S.E.M. shown.

