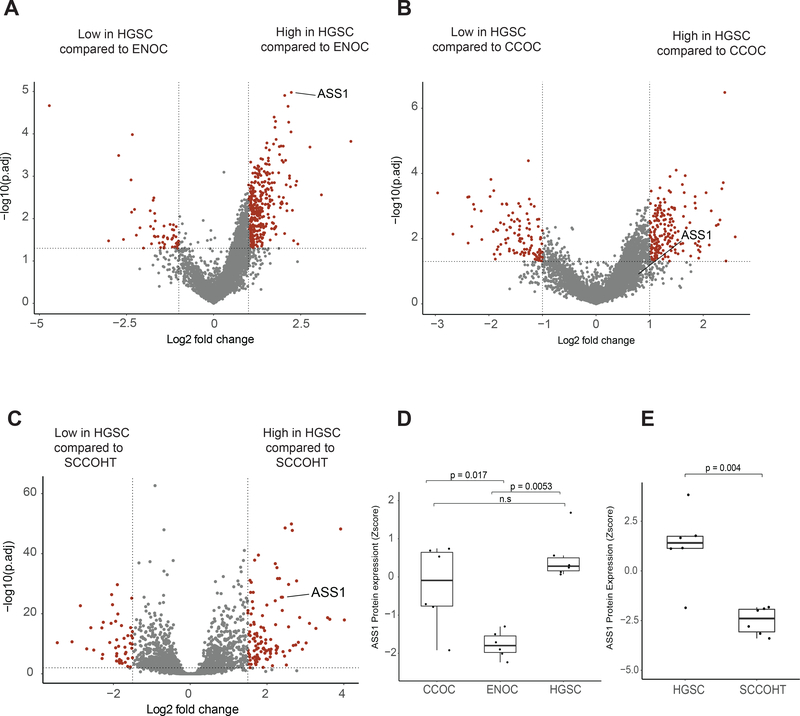
Figure 1. Global proteomics identifies decreased ASS1 expression in rare ovarian cancer subtypes.
Proteomics data for six cases each of CCOC, ENOC and HGSC were obtained from a previous publication (25). An additional six cases each of SCCOHT and HGSC were analyzed using SP3-CTP global proteome profiling. Volcano plot showing differentially expressed proteins comparing A, ENOC to HGSC; B, CCOC to HGSC; and C, SCCOHT to HGSC. Significantly differentially expressed proteins are highlighted in red, and were defined as log2 fold change larger than 1 or smaller than −1, and a FDR-adjusted p < 0.05. Boxplot showing ASS1 protein expression z-score in each case of D, CCOC, ENOC and HGSC; and E, SCCOHT compared to HGSC. The statistical significance in multiple group comparisons is calculated with a Kruskal-Wallis test with a post-hoc dunn’s test with Benjamini-Hochberg correction. Pairwise comparison in figure 1E was calculated using a Mann-Whitney U test.

