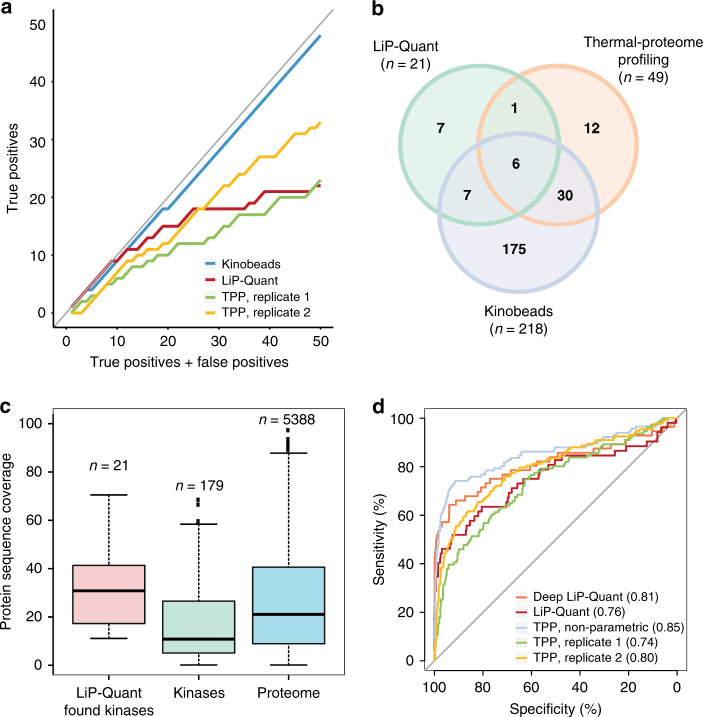
Fig. 2. Benchmarking the LiP-Quant approach.
a True positive rate evaluation for selected assays (LiP-Quant, thermal proteome profiling (TPP) and kinobeads) focused on kinase target identification for staurosporine6,23. True positive hits in the top 50 candidates (see Methods section) are shown as a function of the number of true and false positives in the candidate list for the respective assays. Since staurosporine is a promiscuous binder of protein kinases, we considered the entire protein kinase space as the reference for true positive identifications. The gray line indicates a perfect candidate list containing only true positives (slope = 1). b Total number of kinase targets, as well as common kinase targets of staurosporine found in the LiP-Quant, TPP and kinobeads experiments. c Distribution of protein sequence coverage for kinases identified by LiP-Quant (pink, n = 21), all quantified protein kinases by MS in HeLa cells (green, n = 179) and the entire measured proteome (blue, n = 5388). In the box plots the central line defines the median, the bounds of box the first and third quartile, the whiskers are the minimal and maximum values. d Receiver operating characteristic (ROC) curves of staurosporine protein interactions measured by three different chemoproteomics methods. The ROC curve of LiP-Quant (red) is compared with that of two replicates of TPP experiments based on melting point fittings (green and yellow), a non-parametric analysis of whole TPP dose–response curves (cyan) and LiP-Quant with a LC-MS gradient of 4 h (Deep LiP-Quant). Bracketed numbers represent areas under the curves (AUC). The gray line represents a random classifier. The ground truth is represented by the 512 protein kinases present in the human genome. Source data are provided as a Source Data file.

