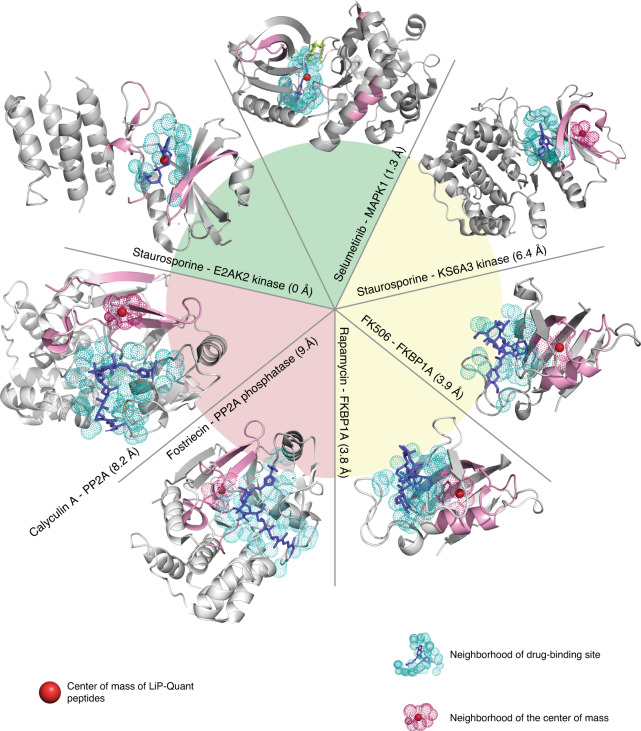
Fig. 3. Approximating drug binding sites positions with LiP-Quant.
Structures of protein–drug complexes: (clockwise sorting) Staurosporine—E2AK2 kinase (PDBID: 2a19), Selumetinib— MAPK2K1 (PDBID: 4u7z), Staurosporine—K66A3 kinase (PDBID: 4nus), FK506–FKBP1A (PDBID: 1fkj), Rapamycin—FKBP1A (PDBID: 2dg3), Fostriecin—PP2A (PDBID: 1it6), Calyculin A—PP2A (PDBID: 1it6). Drug ligands are depicted in blue and LiP-Quant peptides in pink. The center of mass of the LiP-Quant peptides in each structure is shown with red spheres. Cyan shaded dots show a 4 Å radius (equivalent to van der Waals distance) from the drug ligand atoms and are used as a proxy for the residues of the ligand binding cleft. Magenta shaded dots show a 4 Å radius (equivalent to van der Waals distance) from the residues at the center of mass of the LiP-Quant peptides. Minimal distances between the LiP-Quant peptide center of mass and the drug binding cleft are reported. The green and yellow wedges indicate the drug protein pairs where the drug binding site and center of mass overlap, or show intersecting volumes, respectively. Calyculin A and Fostriecin (beige slice) are the only two cases where the ligand center of mass neighborhood and the drug binding site do not converge, although they are proximal.

