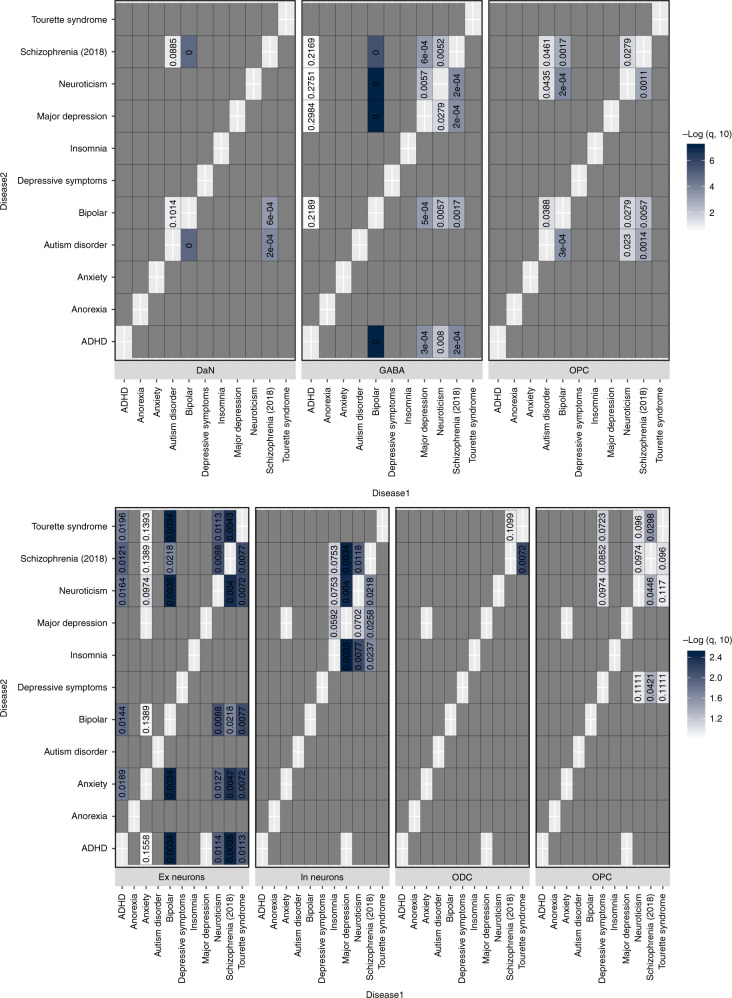
Fig. 3. Evaluation of the shared cell-type associations between pairs of neuropsychiatric disorders.
Evaluation of alike cell-type associations between any two neuropsychiatric disorders to identify any shared cell-type-specific component of risk, for the SN cell types (top) and the cortex (bottom). Each heatmap represents the results from LDSC of the associations (p value associated with an LDSC coefficient) of a specific cell-type expression profile with the genetic risk of a given neuropsychiatric disorder (disease1—X-axis) after conditioning on the genetic risk of another neuropsychiatric disorder (disease2—Y-axis). This analysis was only performed where two neuropsychiatric disorders showed a significant (or suggestive) association with the same cell type (Fig. 2). The blue heatmap colours are proportional to −log10 q value (FDR-adjusted p value) of the enrichment of genetic variants associated with a disorder adjusted for another disorder. The cell associations that were not evaluated (no overlap in Fig. 2) are coloured in dark grey.

