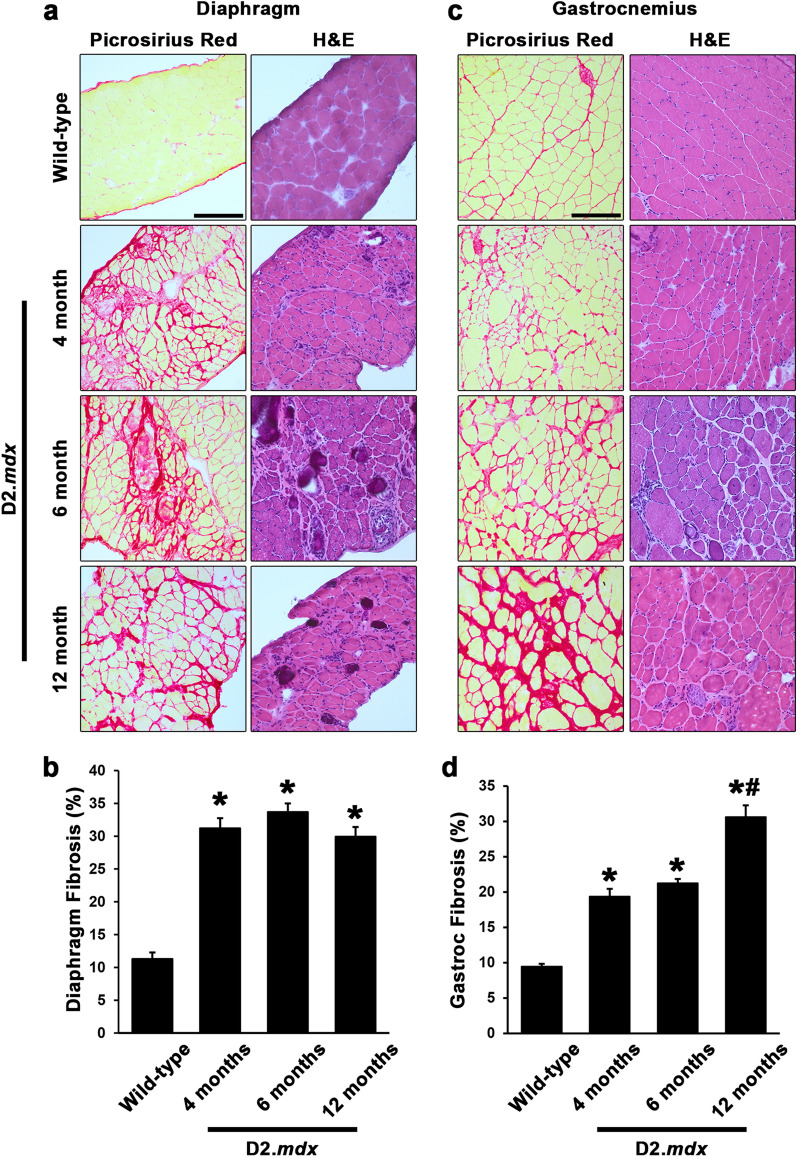
Figure 5.
Histological quantification of D2.mdx skeletal muscle fibrosis. Representative picrosirius red and hematoxylin and eosin (H&E) images and fibrosis quantifications for (a,b) diaphragm and (c,d) gastrocnemius muscles from male wild-type (4 month-old DBA/2J) and 4, 6, and 12 month-old D2.mdx mice (n = 6–15). Values are reported as mean ± SEM, and data were analyzed using one-way ANOVA followed by Tukey post-hoc tests (*p ≤ 0.05 vs. wild-type levels; #p ≤ 0.05 vs. 4- and 6-month levels).

