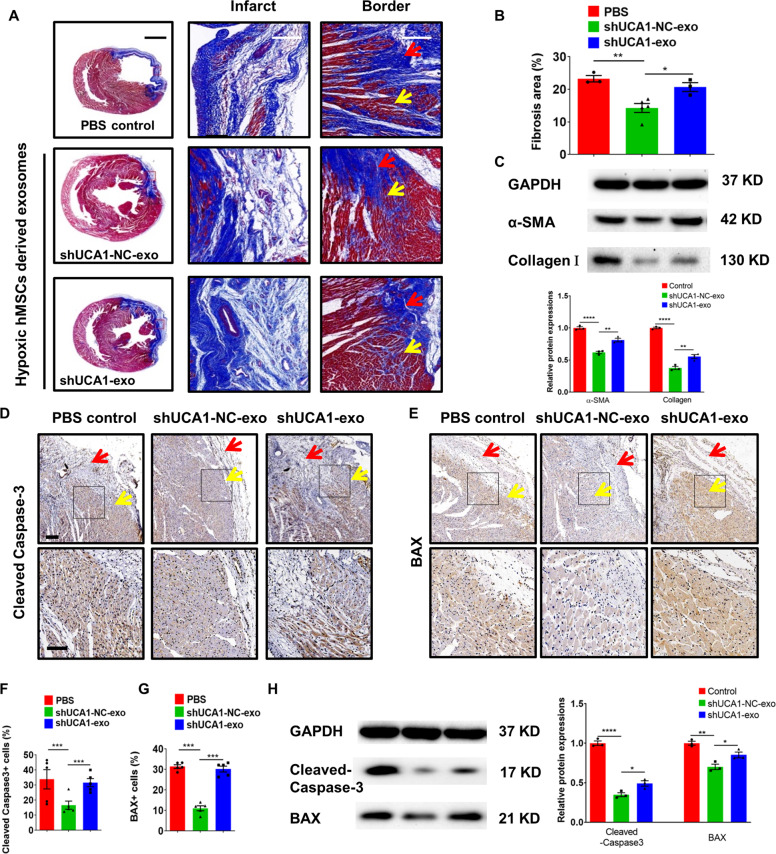
Fig. 5. Effect of shUCA1-NC-Exo in the infracted hearts.
a The representative Masson’s trichrome-stained myocardial cross-sections 4 weeks after AMI with the injection of PBS (MI group), shUCA1-Exo, and shUCA1-NC-Exo. Red arrows indicate the infarct zone and yellow arrows indicate the border zone. Scale bar, 2000 μm. Scale bar, 200 μm. b Quantification of fibrosis size among the different groups (n = 3, 5, and 3 for the PBS, shUCA1-NC-Exo, and shUCA1-Exo groups, respectively). c Representative western blot images and quantified data showing α-SMA and Collagen Ι protein level (n = 3). d, e Cleaved-caspase-3 (d) and BAX (e) staining at the border zone 28 days after MI. Red arrows indicate the infarct zone and yellow arrows indicate the border zone. f, g Quantitative analysis of cleaved-caspase-3+ (f) or BAX+ cells (g) at the border zone among the different groups (3 random fields per animal, n = 5). Scale bar = 200 μm (above), 100 μm (below). h Representative western blot images and quantified data showing cleaved-caspase-3 or BAX protein level (n = 3). Data are presented as mean ± SEM. Statistical analysis was performed with one-way ANOVA followed by Bonferroni’s correction. *P < 0.05, **P < 0.01, ***P < 0.001, ****P < 0.0001.

