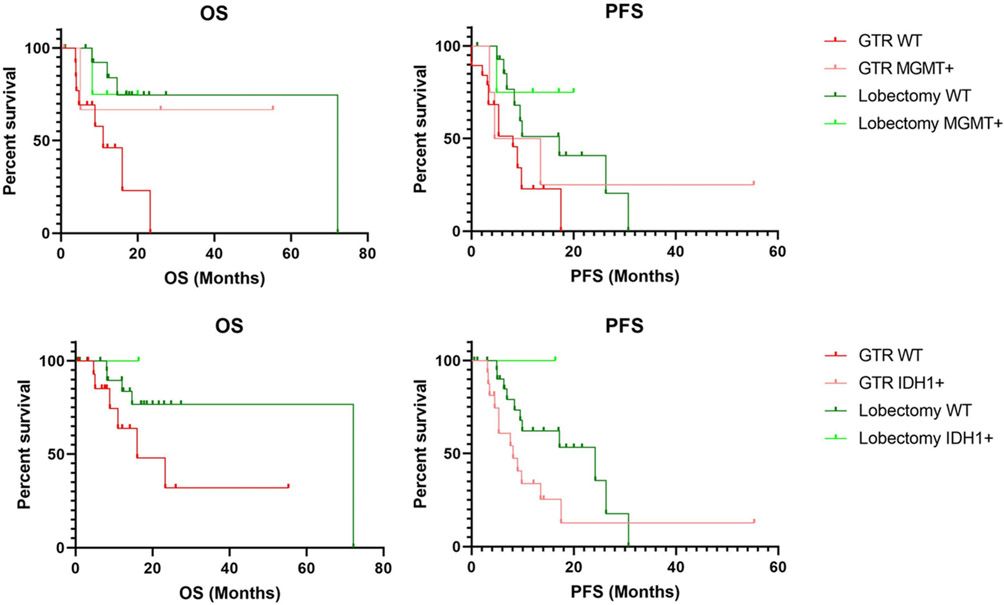
Figure 3: Subgroup survival analysis of patients with MGMT hypermethylation and IDH1 mutations.
MGMT WT patients receiving lobectomy displayed higher median OS (72.2 vs 11) and PFS (17.2 vs 8.1) compared to GTR. IDH1 WT patients receiving lobectomy also displayed higher OS (72.2 vs 16) and PFS (24.2 vs 8.1). Logrank test for trend was statistically significant for all comparisons (p<.05) other than OS for IDH1 mutations which was not significant at p=.0569.

