
Figure 3.
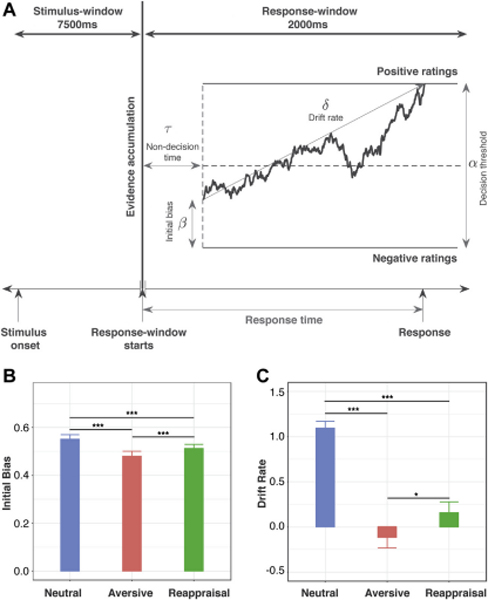
Drift-diffusion model of latent behavioral dynamics. (A) Illustration of a single trial of the drift-diffusion process, in which the random walk represents noisy evidence accumulation over time for a positive versus negative evaluation of the stimulus. When the evidence accumulation process hits either decision boundary (separated by the decision threshold), a response is made. The initial bias captures the bias toward positivity or negativity that is built up over the 7500-ms stimulus window and acts as a starting point for the random walk. The drift rate captures the rate of evidence accumulation during the 2000-ms response window. (B) Children showed significantly greater initial bias under the reappraisal than the aversive condition. Initial bias was highest in the neutral condition. (C) Children showed significantly higher drift rates under the reappraisal than the aversive condition. The drift rate was highest in the neutral condition, *p < .05; **p < .001