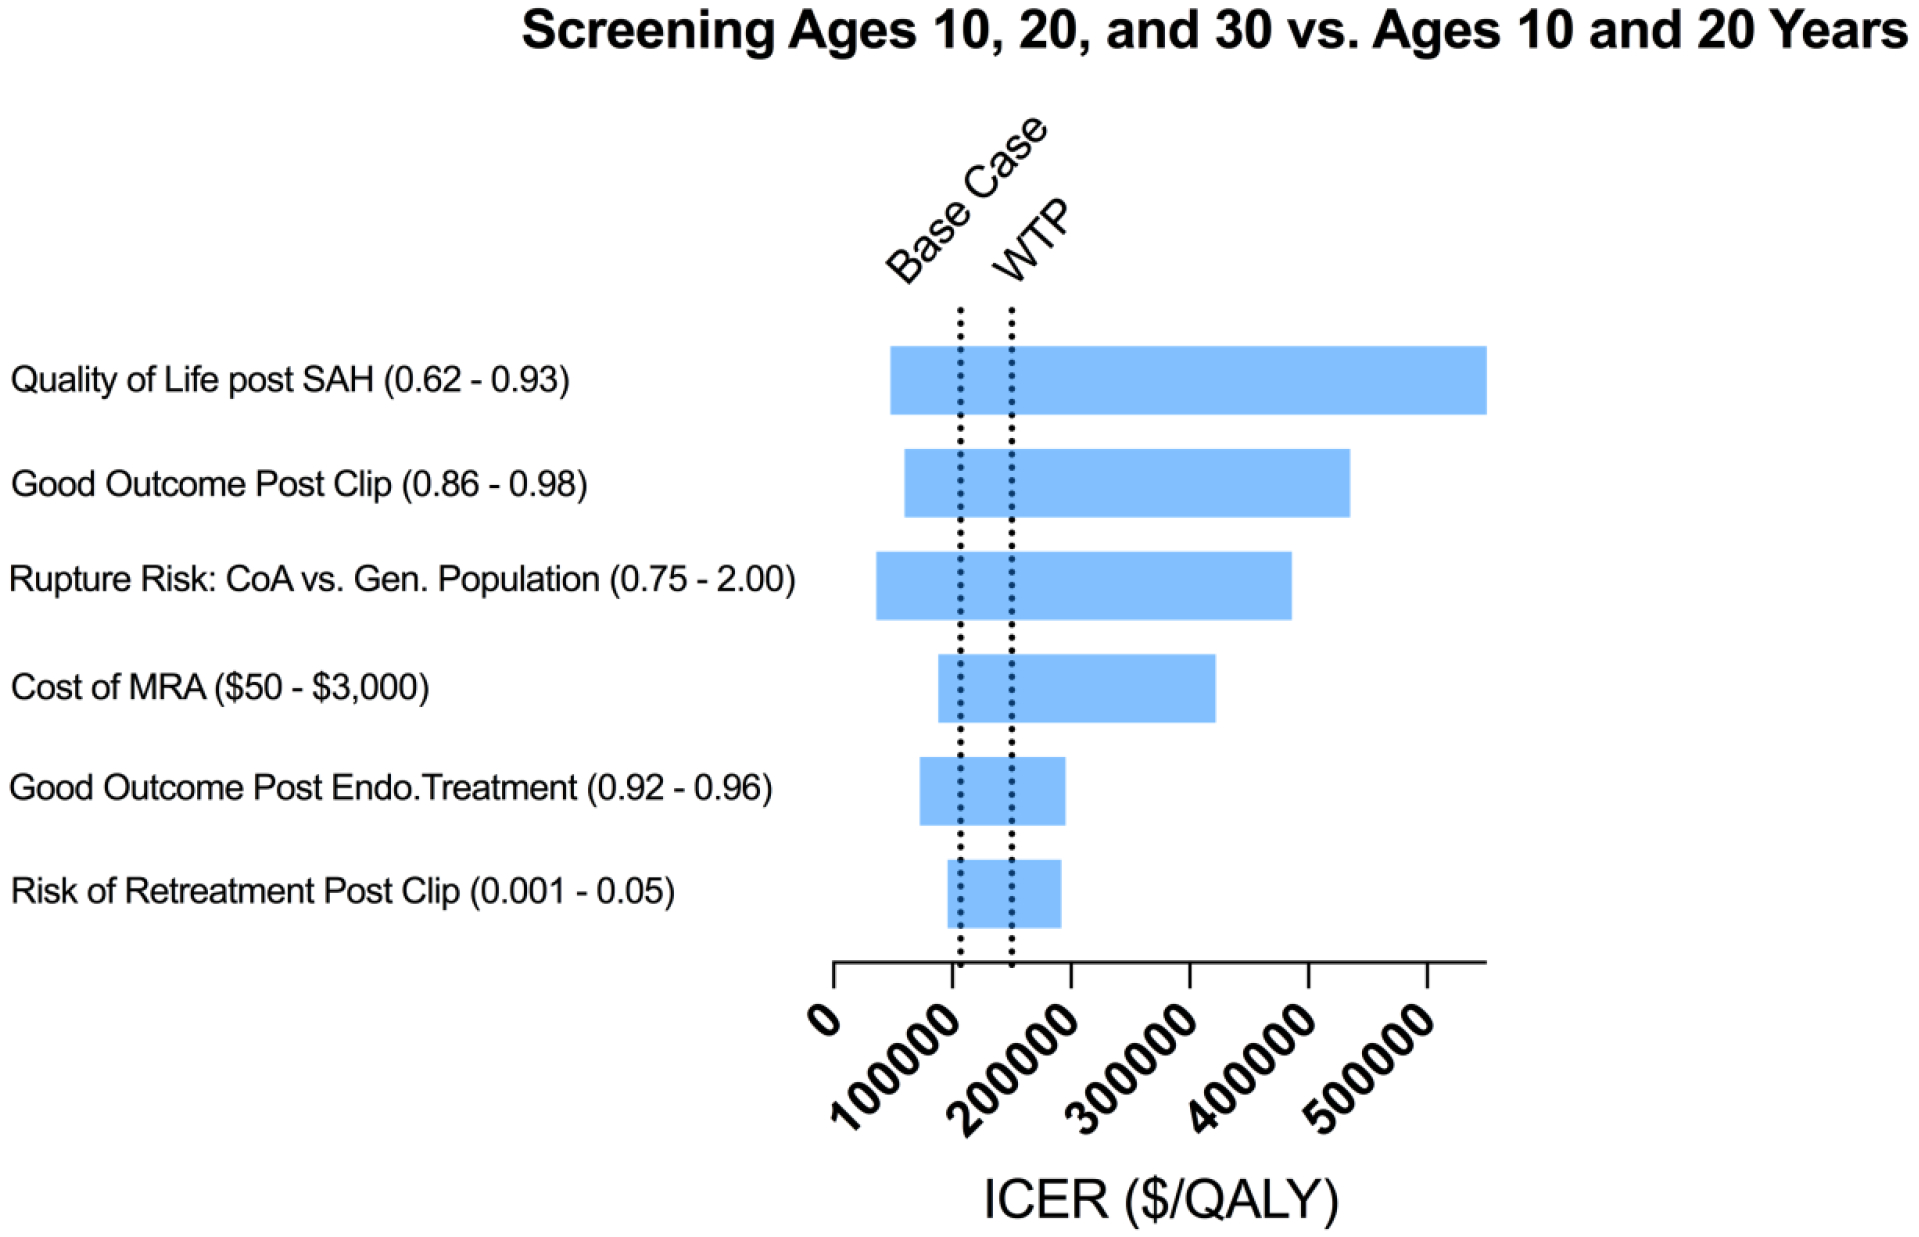
Figure 3.

A tornado diagram of one-way sensitivity analyses to demonstrate the effects of varying parameters on the incremental cost-effectiveness ratio (ICER) for screening at ages 10, 20 and 30 years versus at ages 10 and 20 years. The wider bars at the top have the greatest effect on the ICER [quality of life post subarachnoid hemorrhage (SAH)], while variations in inputs at the bottom have small effects. The willingness-to-pay (WTP) line is at an ICER of $150,000. Variables that accounted for less than 0.1% of total uncertainty were excluded from the diagram. Numbers in parentheses after the variables are the parameter ranges.
