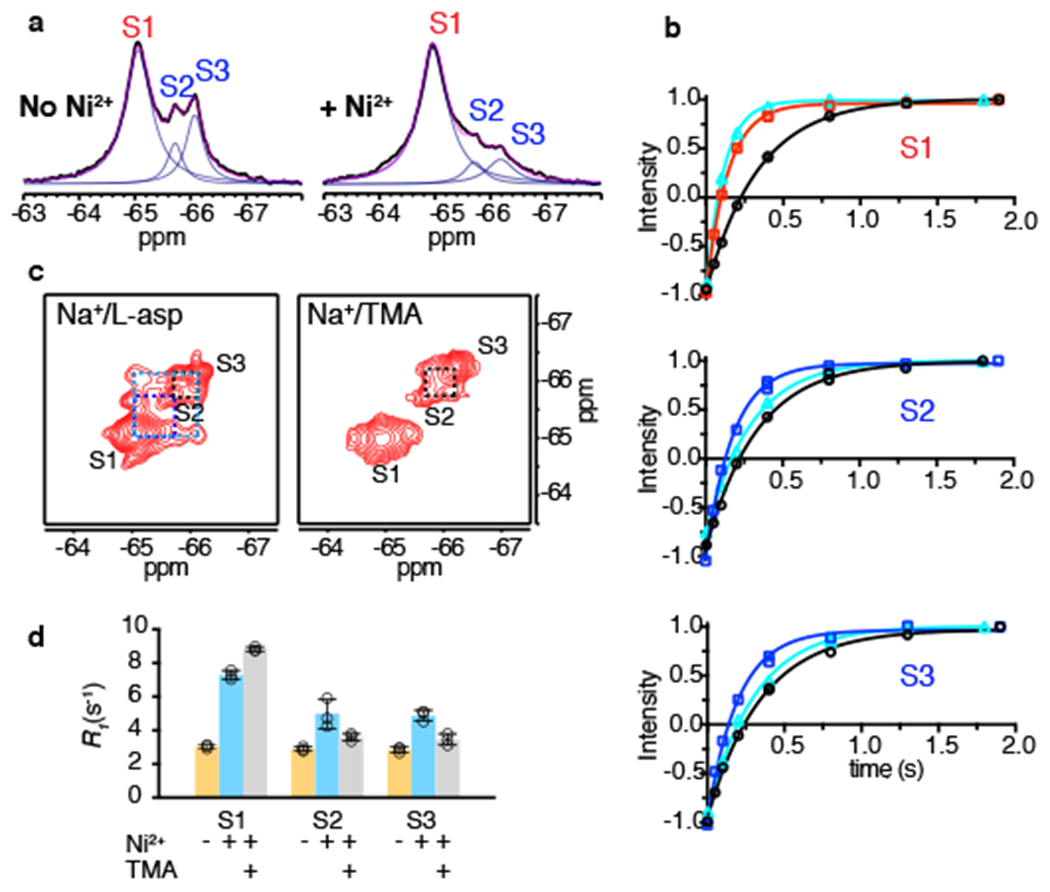
Figure 4: Paramagnetic R1 relaxation and conformational exchange of K290A mutant.

a, 1D 19F spectra of K290A/dHis/M385C-TET GltPh in the absence (left) and presence (right) of Ni2+ ions. Raw data are black, fits are magenta and deconvoluted peaks are blue. b, Representative R1 relaxation traces of S1 (top), S2 (middle) and S3 (bottom) in the absence of Ni2+ ions (black), or in the presence of Ni2+ and bound to L-asp (red for S1, blue for S2 and S3) or TMA (cyan). Solid lines represent mono-exponential fits with fitted R1 values shown in Supplementary Table 1. Three independently prepared samples yielded similar results. c, 19F-19F EXSY spectra of K290A/dHis/M385C-TET GltPh bound to L-asp (left) or TMA (right). Mixing time was set to 0.4 s. Dashed lines indicate cross peaks for S1 and S2 (dark blue), S1 and S3 (light blue) and S2 and S3 (black). d, R1 rates of S1, S2 and S3 peaks of K290A/dHis/M385C-TET in the absence (yellow) and presence of Ni2+ ions and bound to L-asp (cyan) or TMA (gray). Individual data points are shown and the bars indicate means ± s.d. (N = 3).
