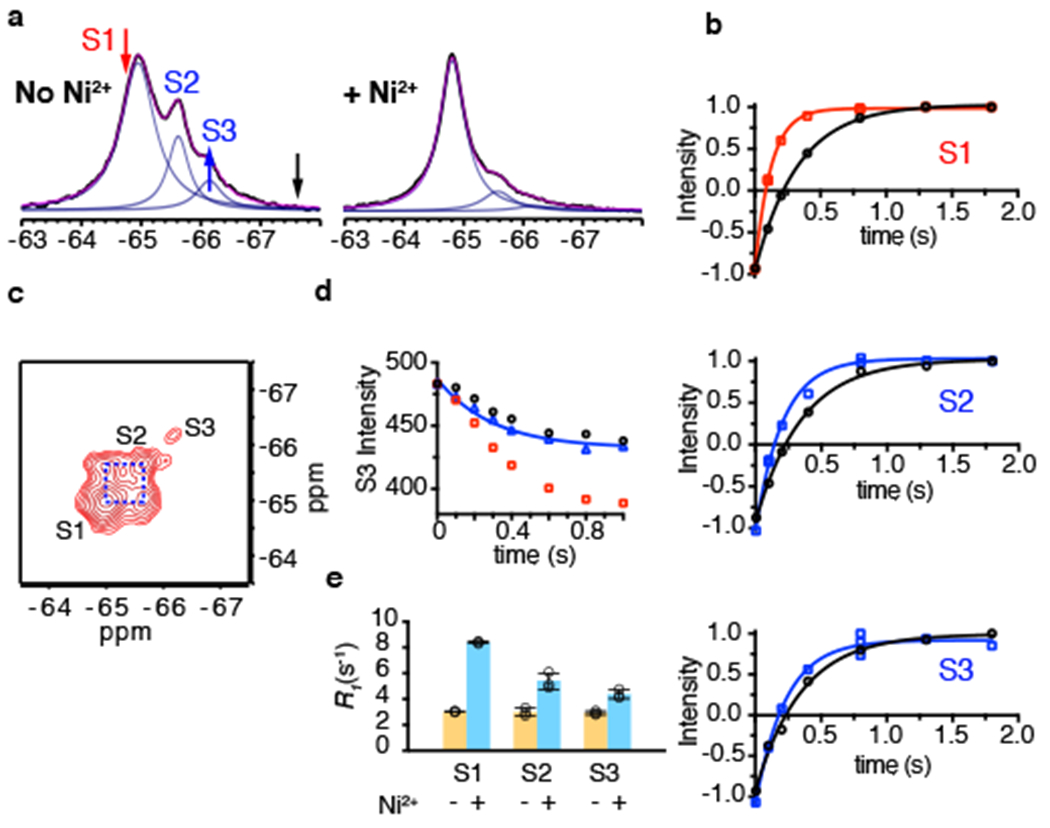
Figure 5: Paramagnetic R1 relaxation and conformational exchange of RSMR mutant.

a, 1D 19F NMR spectra of RSMR/dHis/M385C-TET in the absence (left) and presence (right) of Ni2+ ions. Raw data are black, fits are magenta and deconvoluted peaks are blue. The red, black and blue arrows indicate the saturation pulse, control pulse and observed peak, respectively, in the STD experiment in panel d. b, Representative R1 relaxation traces of S1 (top), S2 (middle) and S3 (bottom) peaks in the absence (black) and presence (red for S1 and blue for S2 and S3) of Ni2+ ions. Solid lines represent mono-exponential fits with fitted R1 values shown in Supplementary Table 1. All measurements are in the presence of 200 mM NaCl and 10 μM L-asp. Three independently prepared samples yielded similar results. c, 19F-19F EXSY spectrum of RSMR/dHis/M385C-TET GltPh in the presence of 200 mM NaCl and 10 μM L-asp recorded with mixing time of 0.4 s. d, Decay of the S3 peak upon saturating the S1 peak (red arrow in a) in the STD experiment (red squares). To account for the off-resonance saturation effect, a control experiment (black circles) was performed at an equidistant frequency to S3 peak (black arrow in a). The effective decay curve (blue triangle) is fit to the Equation 5, with results given in Supplementary Table 1. Two independently prepared samples yielded similar results. e, R1 rates of S1, S2 and S3 peaks of RSMR/dHis/M385C-TET in the absence (yellow) and presence of Ni2+ ions with NaCl and L-asp (cyan). Individual data points are shown and the bars indicate means ± s.d. (N = 3).
