
Extended Data Fig. 1. Protein purity, and 3H L-asp uptake and simulated 19F-Ni2+ distance distribution.
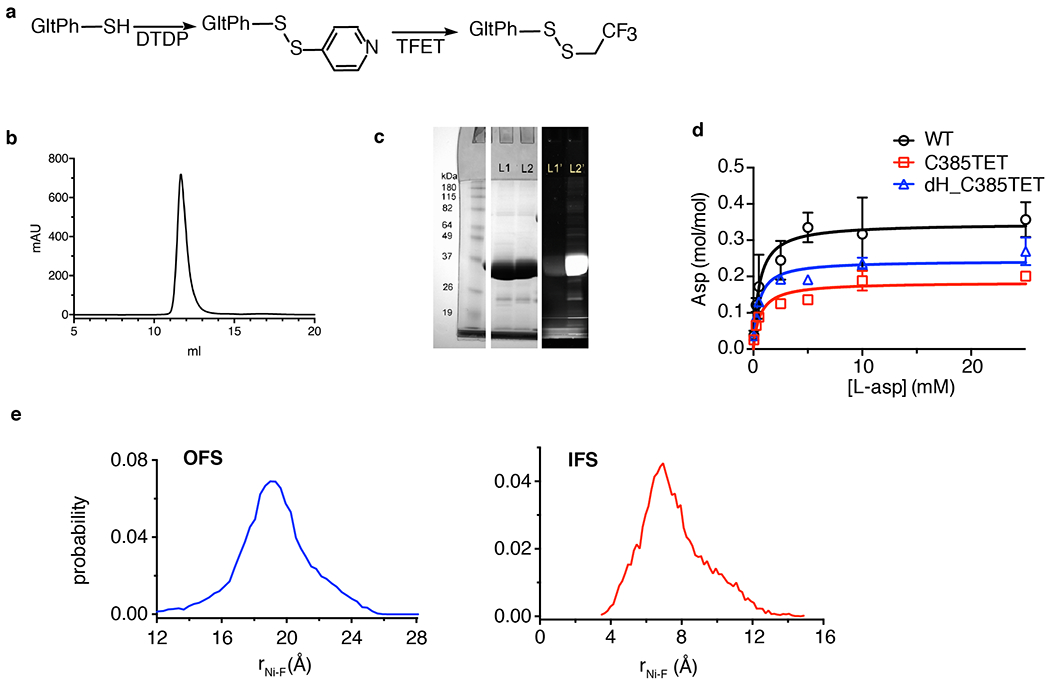
a, Scheme for site-specifically introducing 19F label into M385C GltPh mutant. b, Representative size exclusion chromatography elution profile of M385C-TET GltPh. More than 3 independent samples were repeated with similar results. c, SDS-PAGE gel imaged by Coommasie blue staining (middle) and fluorescence (right) and of M385C GltPh labeled with fluorescein-5-malaimide before (lane 1) and after (lane 2) labeling with TFET. Protein samples were incubated with 10-fold excess of fluorescein-5-maleimide for 4h prior to analysis. Two independent samples were prepared and yielded similar results. d. Michaelis-Menten kinetics of 3H L-Asp uptake for wide type (WT) GltPh (black circle), M385C-TET (red square), and dHis/M385C-TET GltPh (blue triangle). Data shown are means ± s.d. (N = 3 biological replicates). e, Distance probability distributions between 19F and Ni2+ calculated from 100 ns of the molecular dynamics simulation trajectories. To mimic experimental conditions M385 was mutated to NMR probe TET, residues 215 and 219 were mutated to histidine, and Zn2+ ion was constrained between these histidines (see Online Methods for details). The distance distributions were calculated for all three protomers and shown curves are averaged values from three protomers in the OFS (left) and the IFS (right). DTDP: 2,2’-dithiodipyridine; TFET: trifluoroethanethiol.