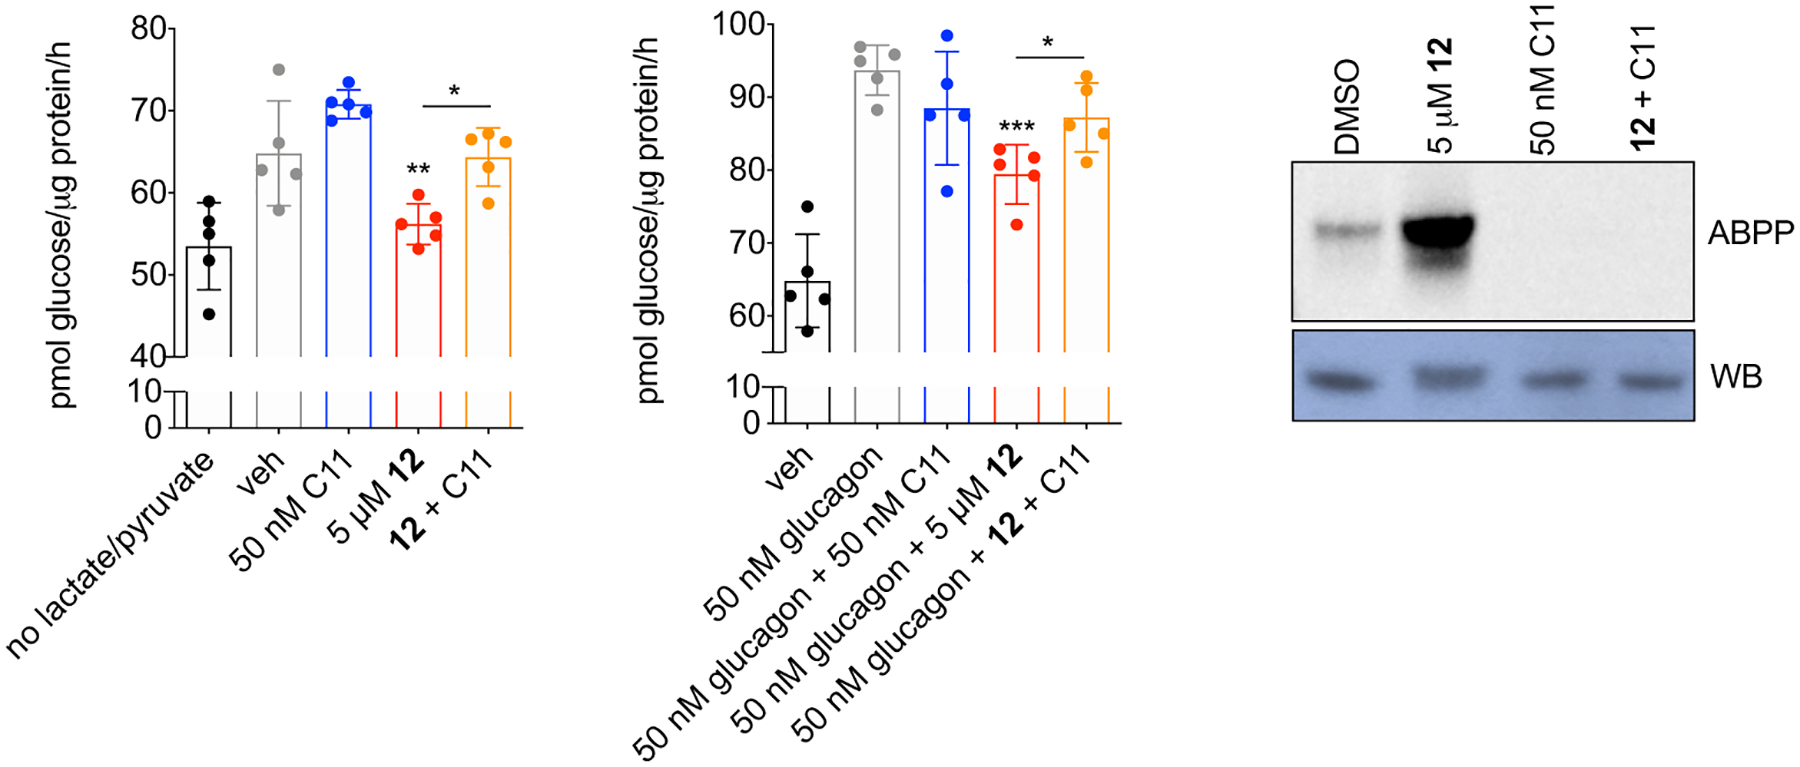
Extended Data Fig. 6. Glucose production in primary mouse hepatocytes treated with LYPLAL1 modulators.

Basal (20 mM lactate/2 mM pyruvate) (left panel) and glucagon-stimulated (middle panel) glucose production was measured in primary mouse hepatocytes treated for 6 h with 12, C11, or both compounds in combination; results were normalized to protein content. Gel-based ABPP analysis of 50 nM purified mLYPLAL1 treated for 1 h with 12, C11, and the combination (right panel). Protein levels are shown in the bottom panel. Error bars represent mean ± s.d.; n=5 per group where n=biologically independent samples; *p=0.02, **p=0.003, ***p=0.0003 by two-tailed t-test. Representative results from two independent experiments; similar results were obtained in each experiment. Uncropped gels/blots are shown in Supplementary Fig. 6
