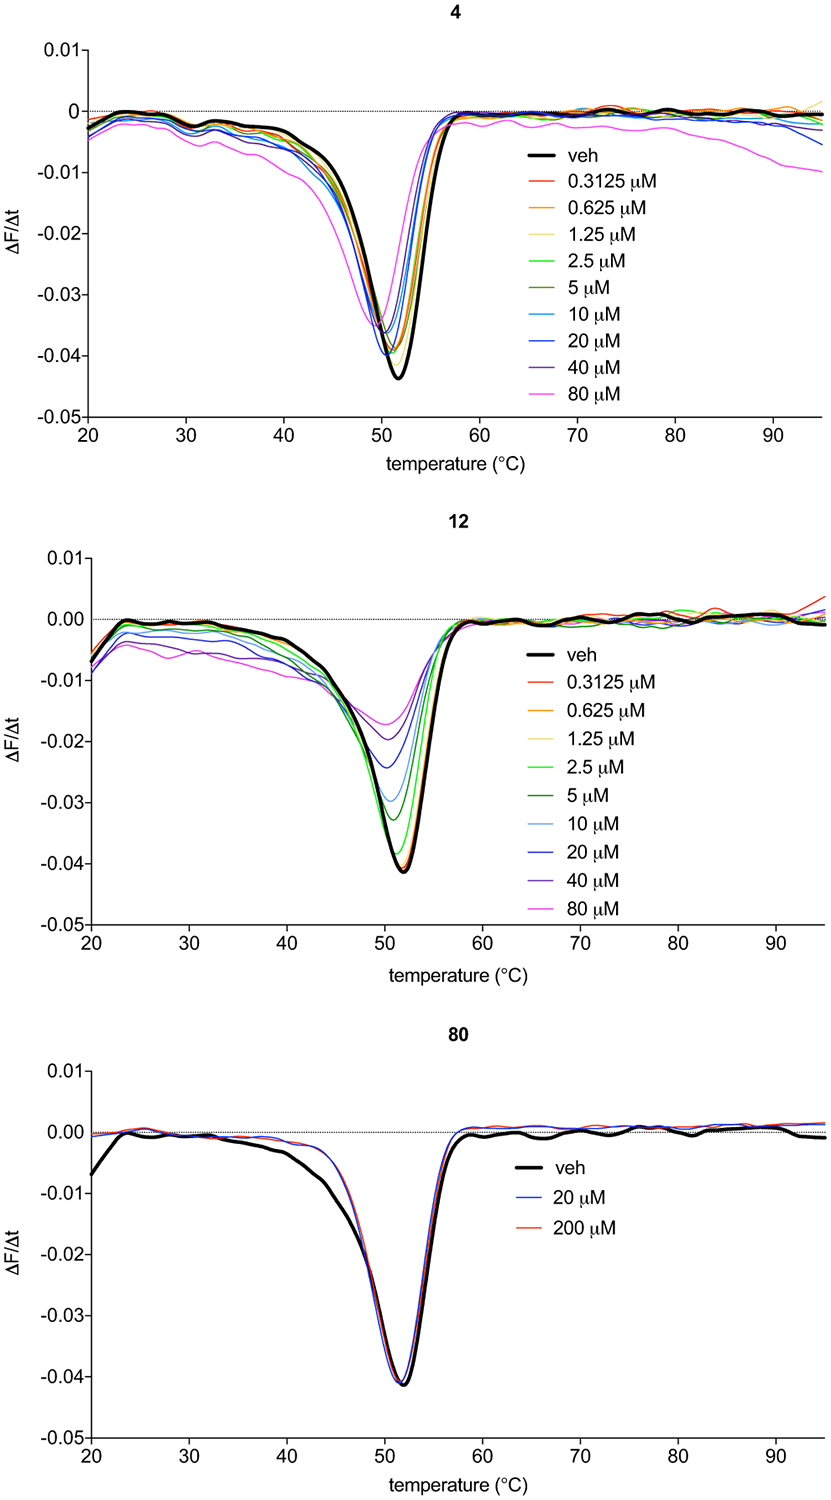
Extended Data Fig. 3. Derivatized thermal melt curves for compound-treated mLYPLAL1.

Temperature-dependent fluorescence shifts in purified mLYPLAL1 incubated with increasing concentrations of 4 and 12. Increased protein flexibility is noted upon compound interaction. In contrast, an inactive compound, 80, does not shift the derivatized thermal melt curve of mLYPLAL1. Representative results from three independent experiments; similar results were obtained in all experiments.
