
Extended Data Fig. 8. Alteration of transcription networks in E. coli-challenged mice.
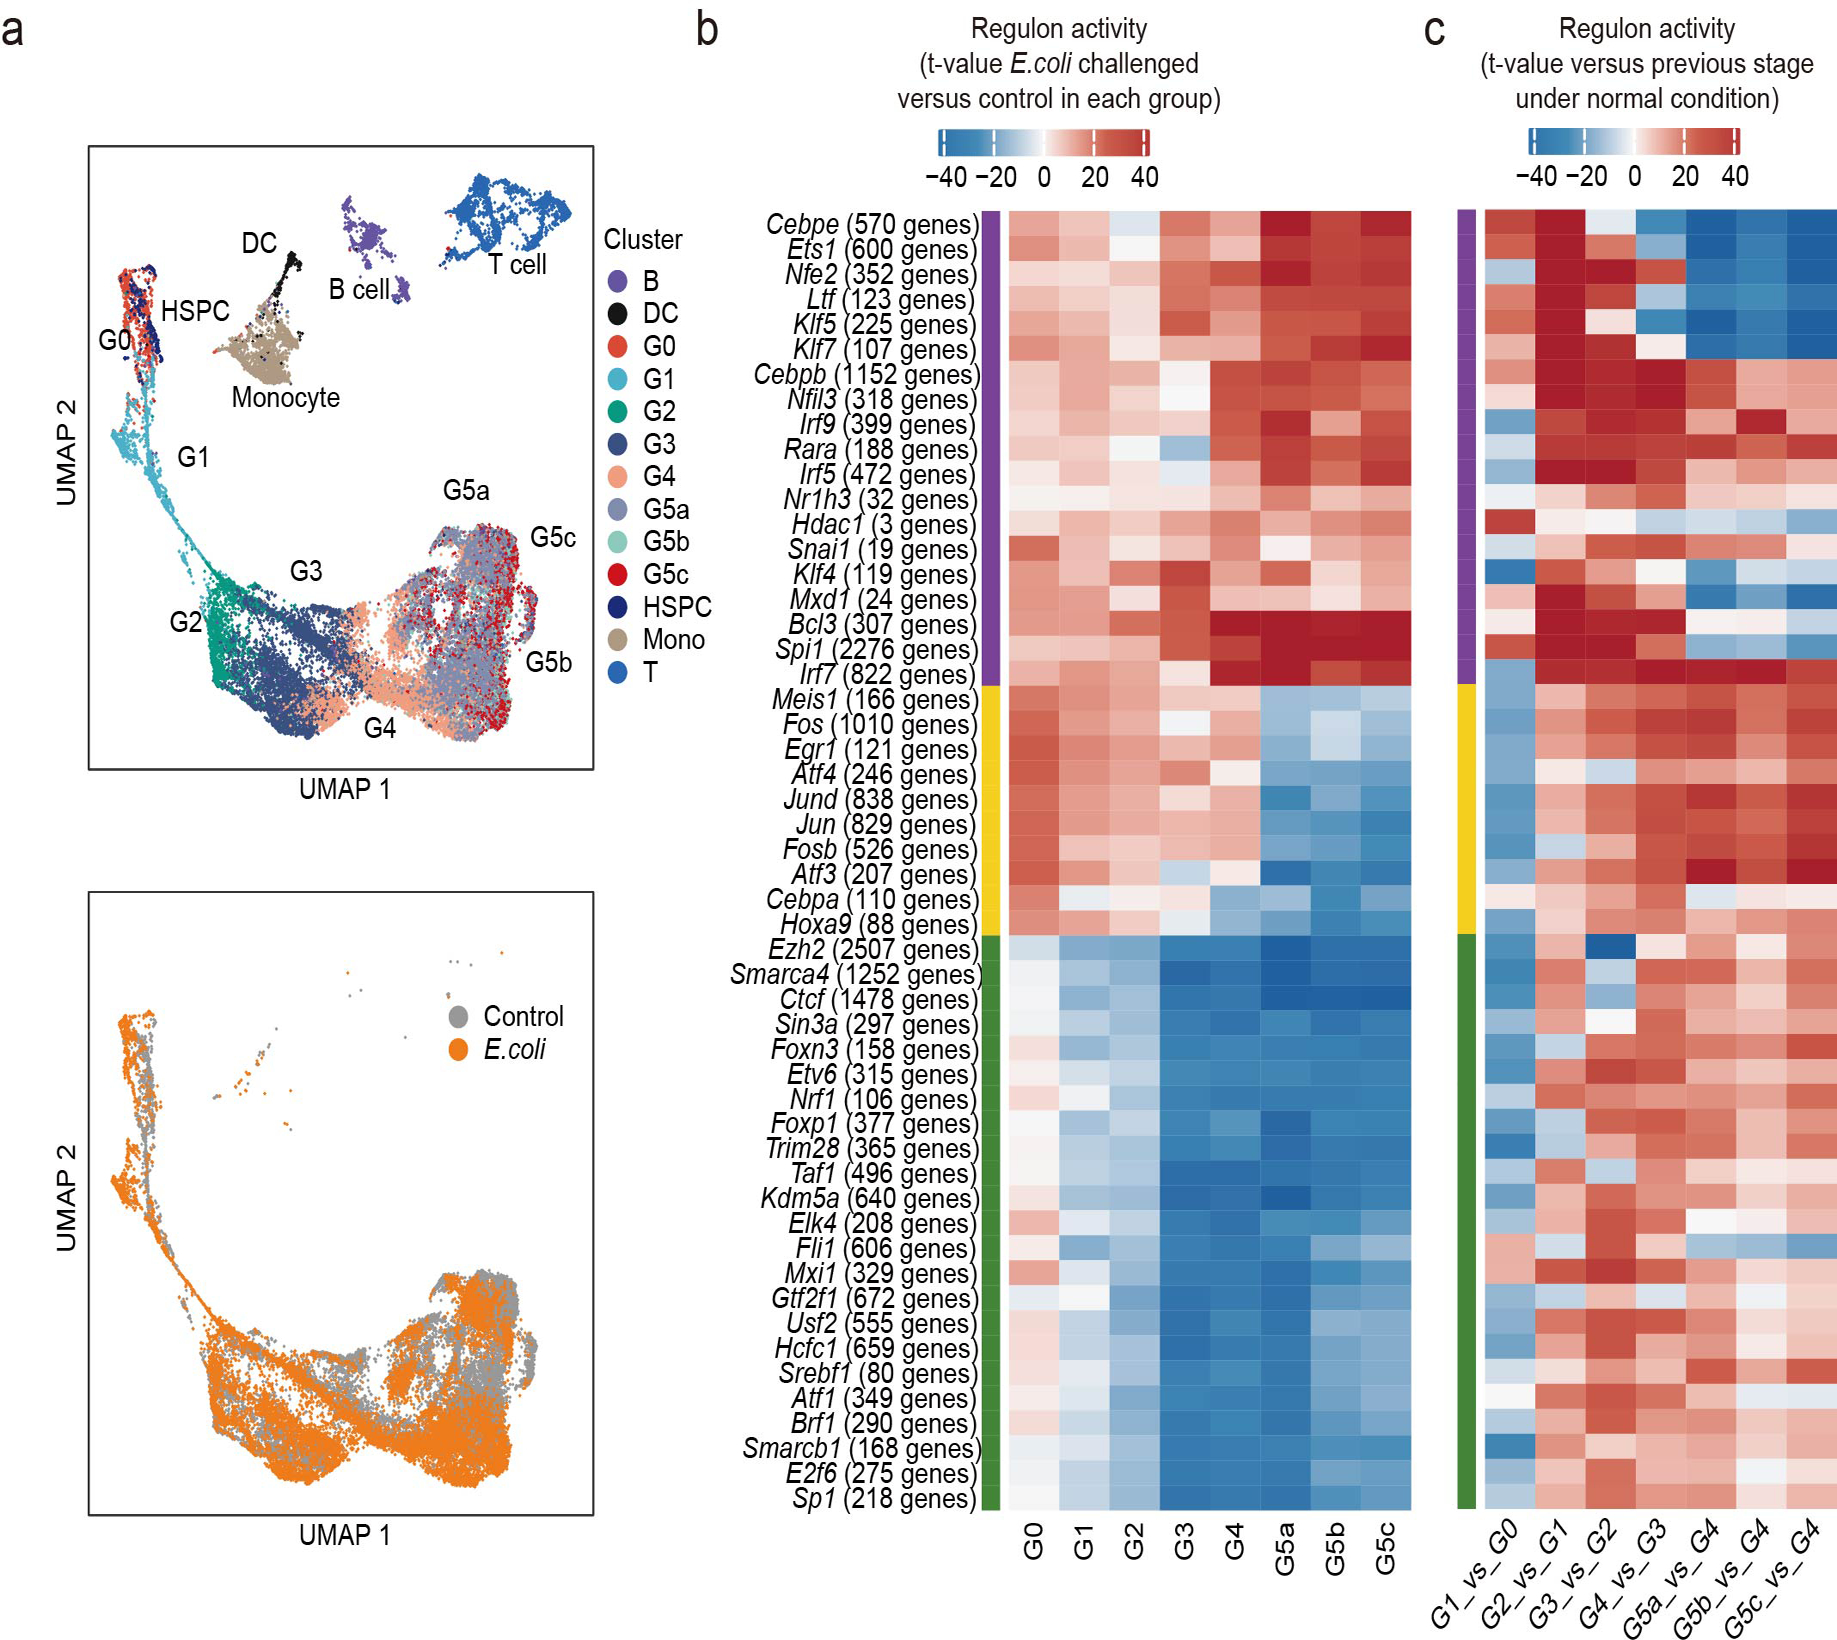
a, UMAP of the regulon activity matrix of 32,888 cells (11,992 normal neutrophils, 13,687 challenged neutrophils, and 7209 other cells under normal conditions) colored by Seurat cluster identity (top) or experimental condition (bottom, only neutrophils).
b, Heatmap of the t-values of regulon activity derived from a generalized linear model for the difference between cells from one challenged neutrophil subpopulation and cells from the corresponding normal subpopulation. Only regulons with at least one absolute t-value greater than 18 are visualized. Regulons are hierarchically clustered based on challenge-response pattern (purple: upregulated, yellow: first up- then downregulated, green: downregulated)
c, Heatmap showing activity change of regulons identified in (b) during normal group transitions.