
Figure 3. Analysis of neutrophil subpopulations by flow cytometry.
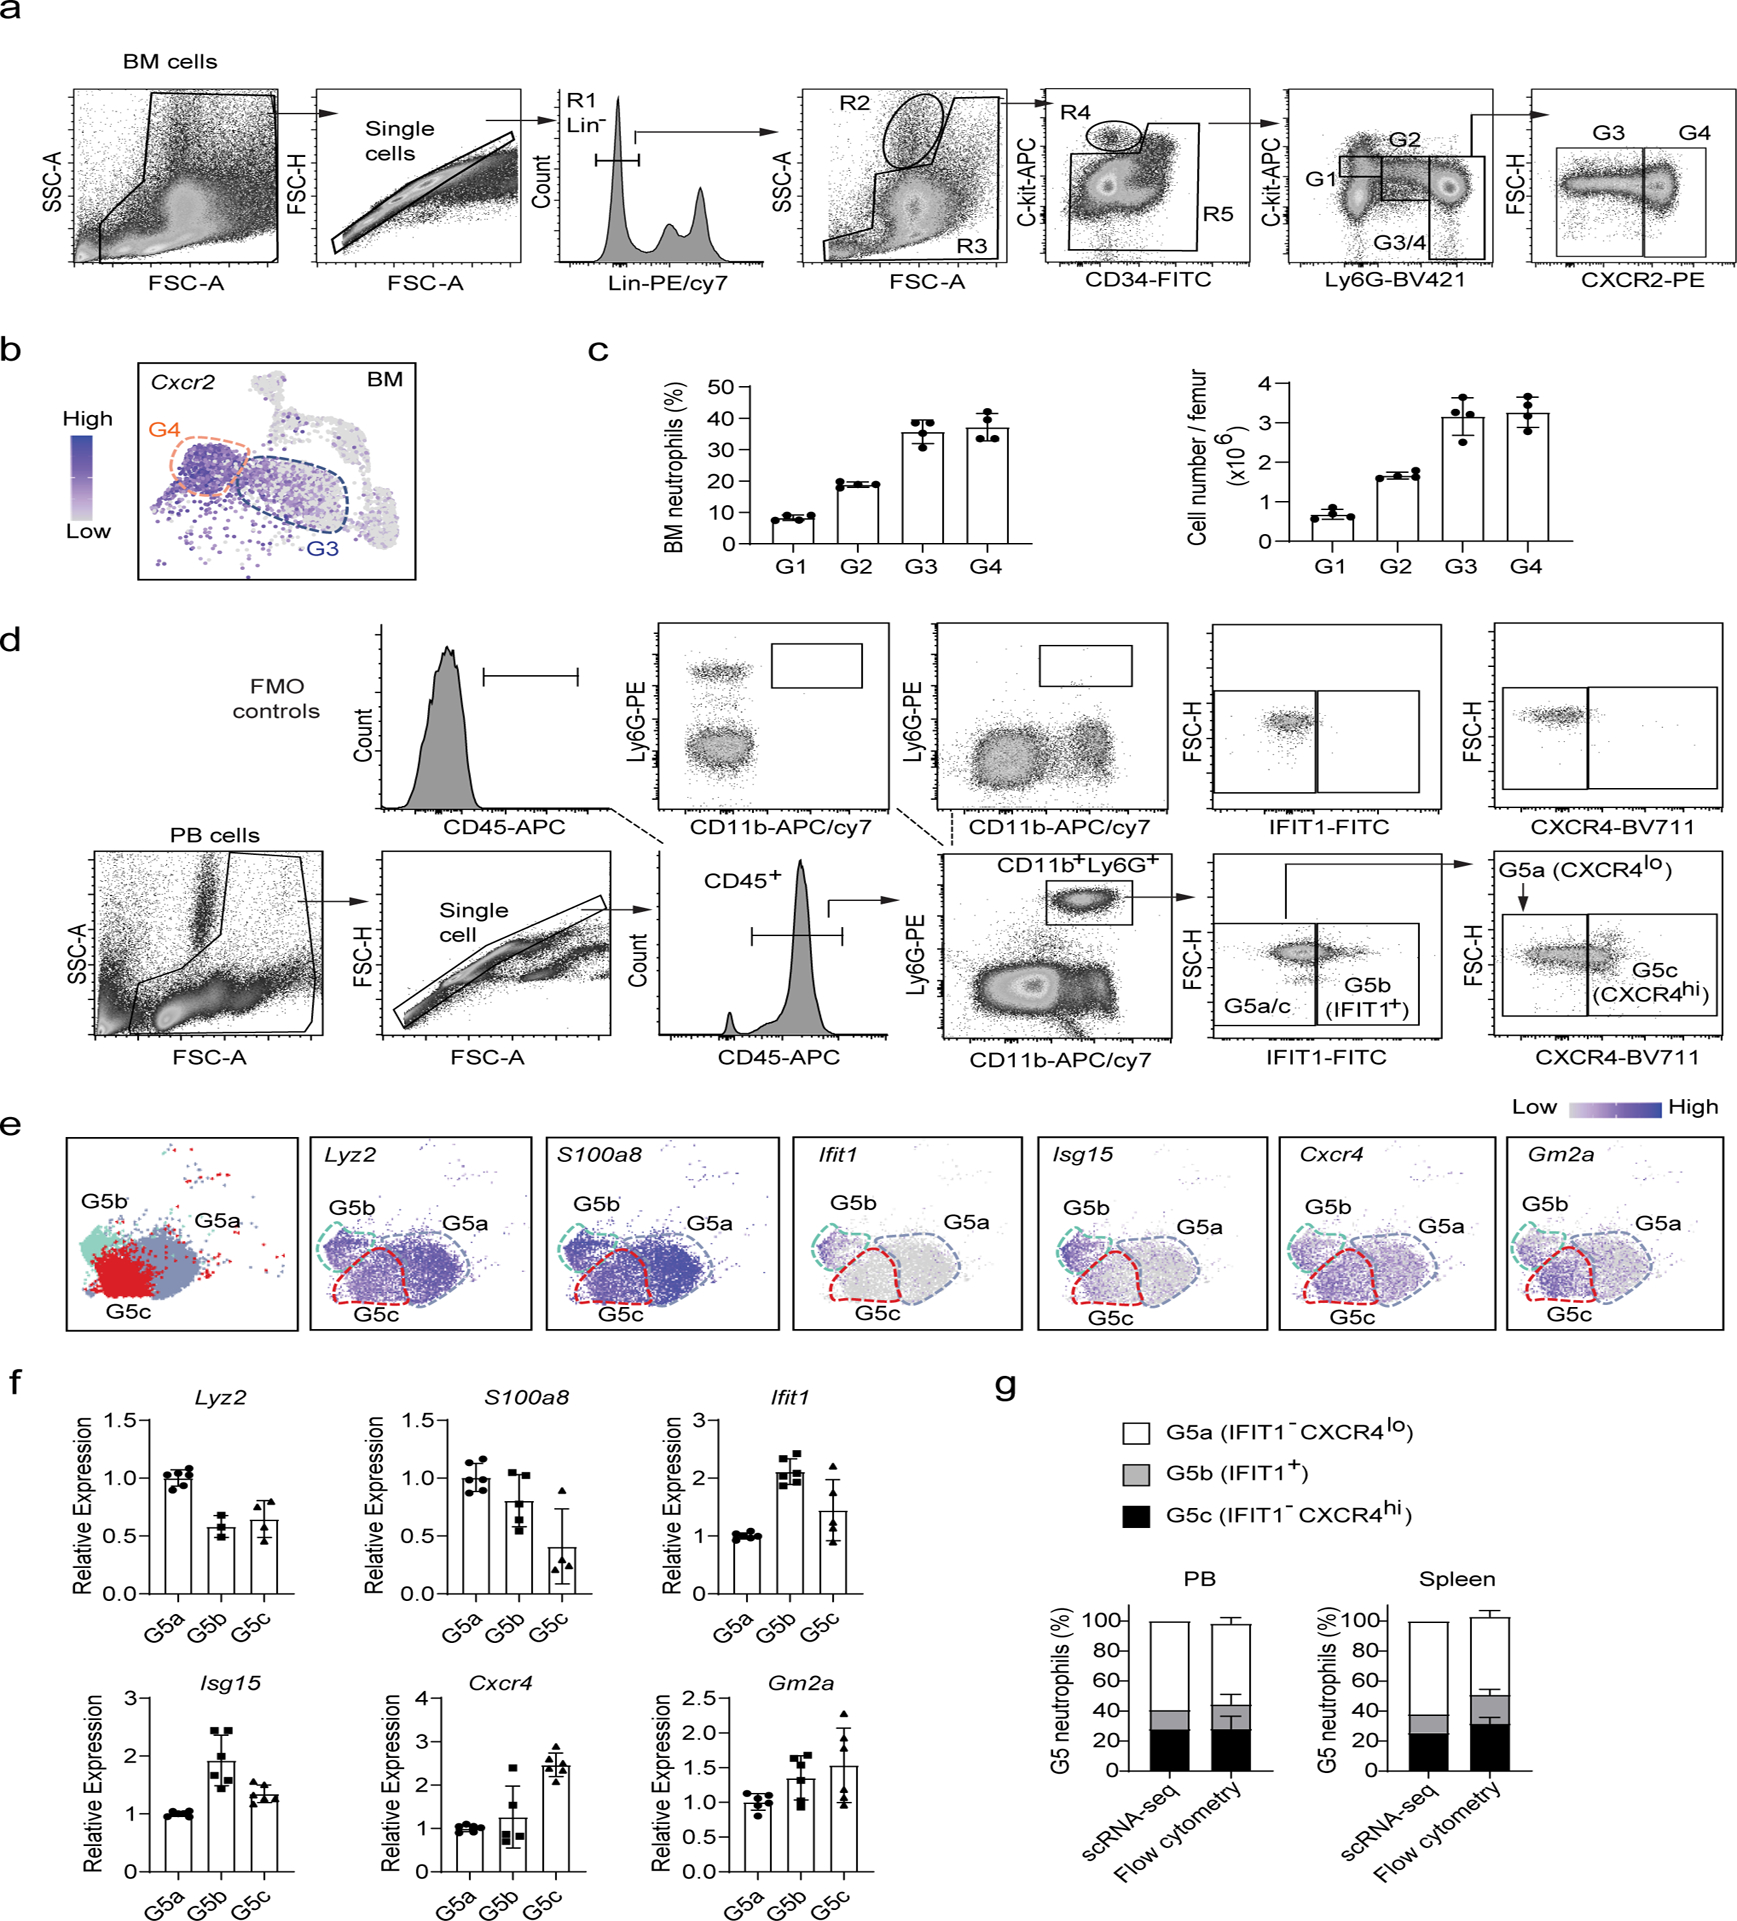
(a-c) Separation of bone marrow maturating G1-G4 neutrophils.
a, FACS and staining strategy. The experiments were conducted as described in Fig. 2d. Data are representative of two independent experiments
b, Expression pattern of the gene Cxcr2 projected on the UMAP plot. Only bone morrow cells are shown.
c, Percentage and absolute number of different neutrophil populations in the bone marrow. Data represent mean ± SD (n= 4 mice) of two independent experiments.
(d-f) Separation of G5a, G5b and G5c neutrophils by flow cytometry.
d, FACS and staining strategy for peripheral blood G5a (IFIT1−CXCR4lo), G5b (IFIT1+) and G5c (IFIT1− CXCR4hi) neutrophils. Fluorescence minus one (FMO) controls were used to control for spillover-related contribution to background in each channel.
e, Left: UMAP plot of G5a, G5b and G5c neutrophils colored by cluster identity. Right: Expression pattern of the marker genes of G5a (Lyz2 and S100a8), G5b (Ifit1 and Isg15), and G5c (Cxcr4 and Gm2a) projected on the UMAP plot.
f, Relative mRNA expression of the 6 marker genes in sorted peripheral blood G5a, G5b and G5c neutrophils measured by qRT-PCR. Data represent mean ± SD (n=15 mice) of two independent experiments.
g, Comparation of FACS and scRNA-seq-based analyses of G5 subpopulations in the peripheral blood and spleen. The scRNA-seq-based percentages of each G5 subpopulation were derived from Fig. 1c. FACS-based measurement was conducted as described in (D). Data represent mean ± SD (n=3–6 mice) of two independent experiments.