
Figure 4. (a-d) The origin and inter-relationship of neutrophil subpopulations.
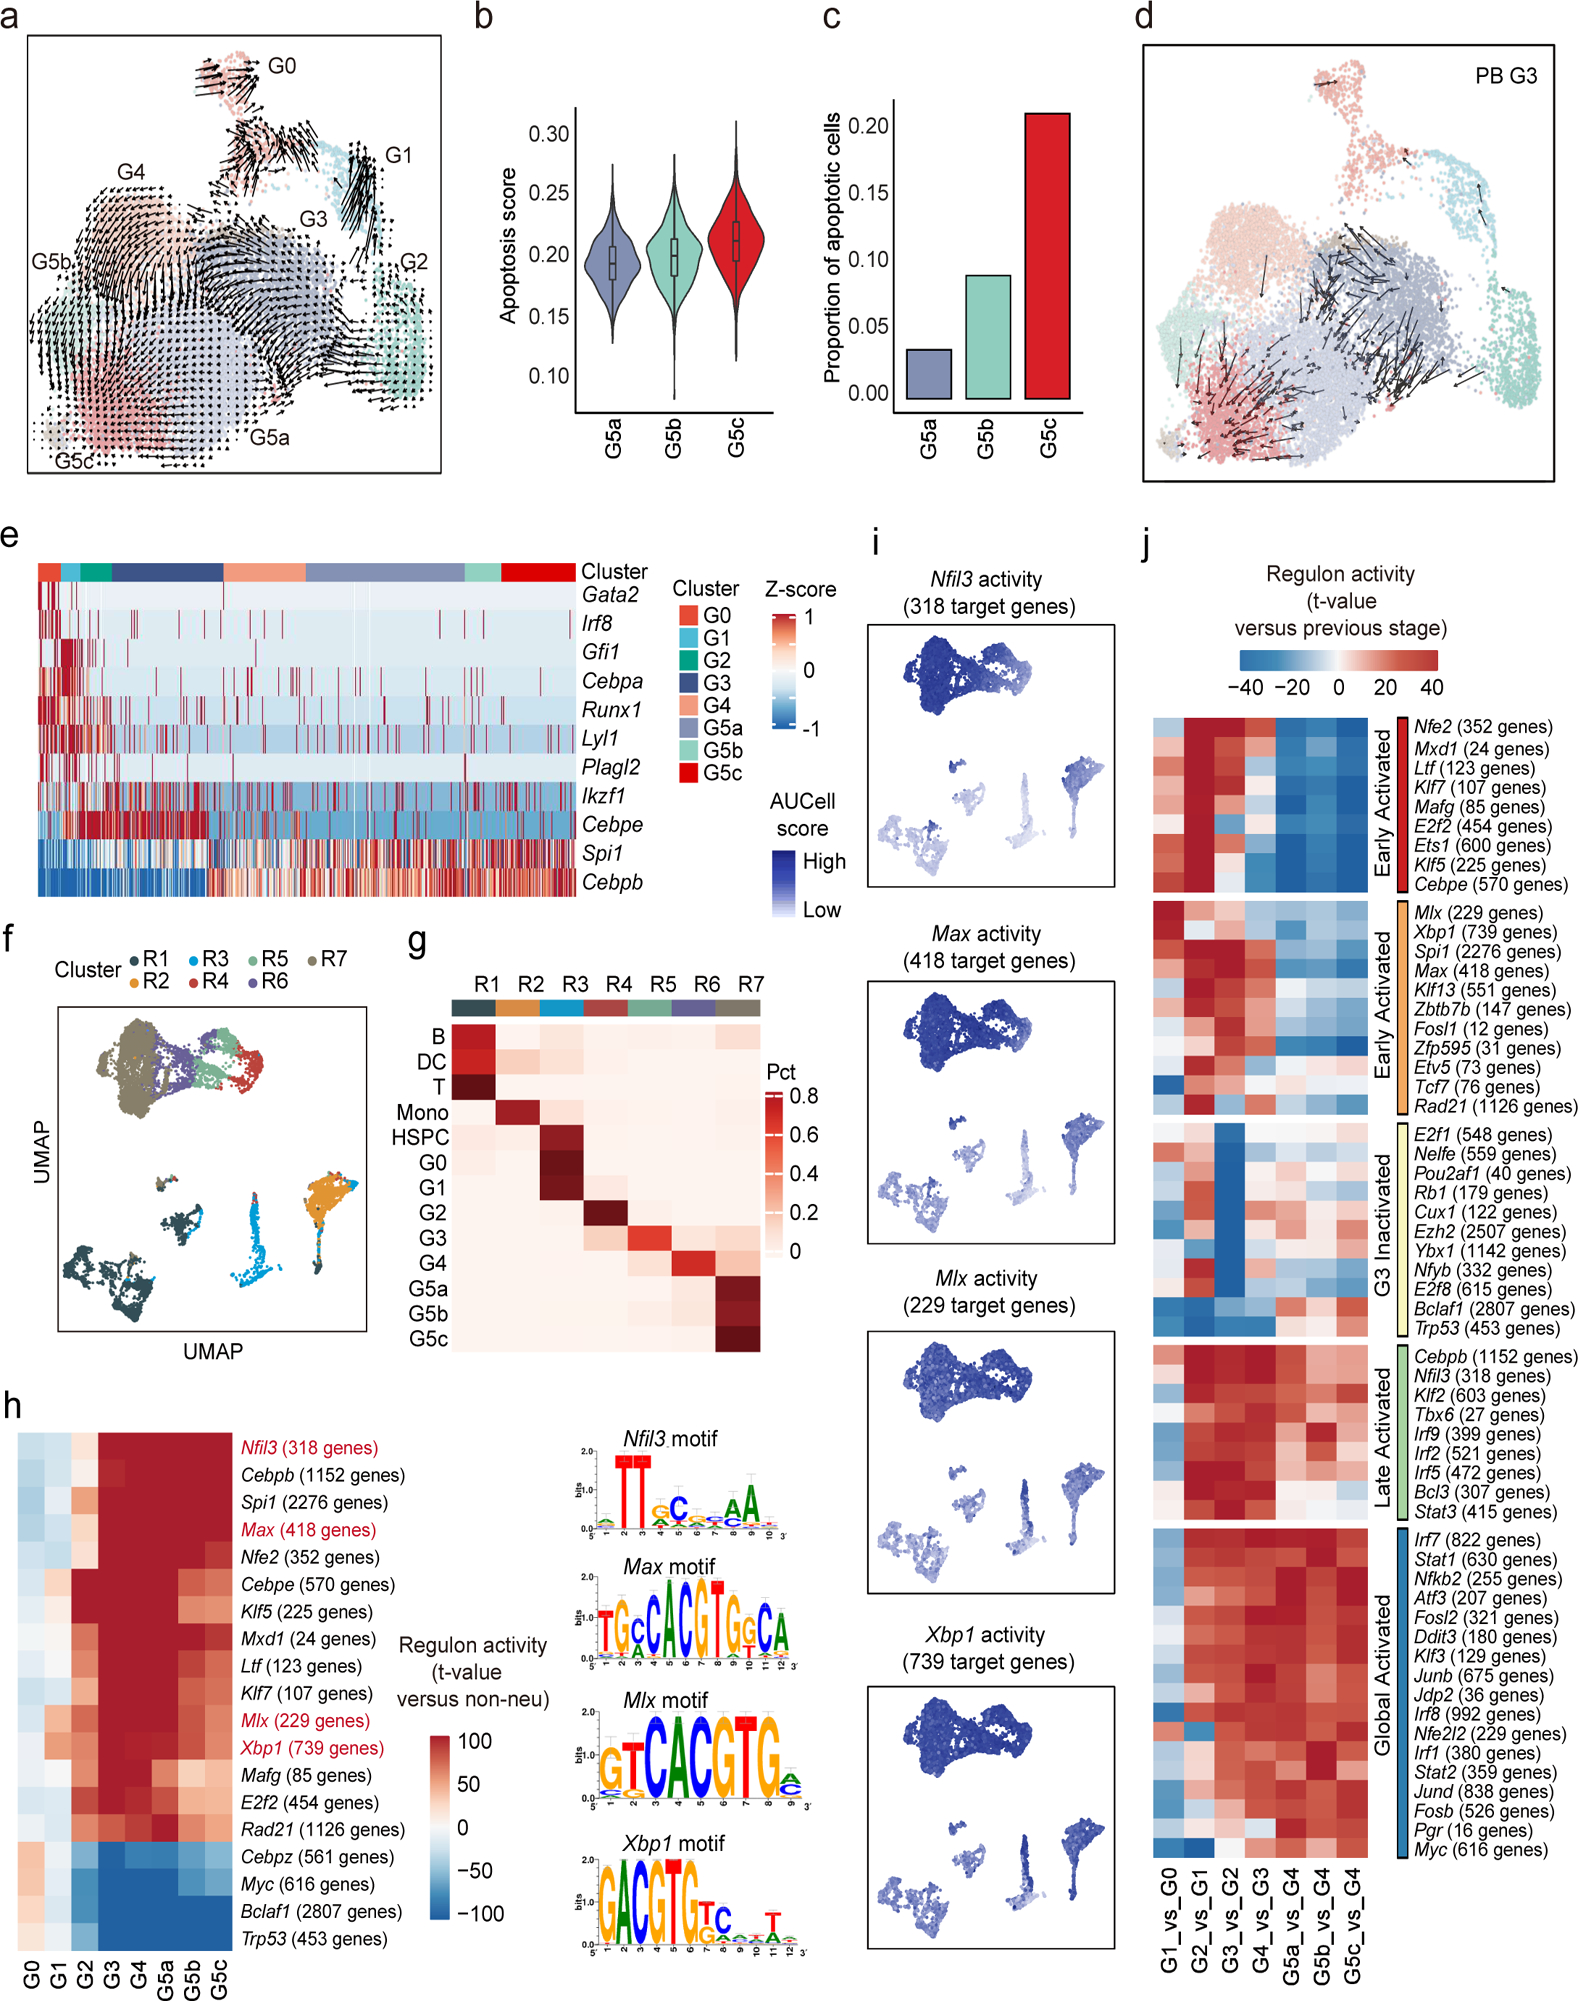
a, Velocity analysis reveals the origin and inter-relationship of neutrophil subpopulations. Velocity fields were projected onto the UMAP plot.
b, Violin plot of apoptosis scores (GO:0043065) for G5 clusters.
c, Proportions of apoptotic cells in each cluster identified by a two-component Gaussian mixture model.
d, As in (a) but only of G3 neutrophils originating from PB.
(e-j) The formation of neutrophil subpopulations is driven by both known and a large set of uncharacterized transcription factors.
e, Heatmap showing row-scaled gene expression of TFs known to be involved in granulopoiesis and neutrophil function.
f, UMAP of the regulon activity matrix of neutrophils and 7209 non-neutrophils under normal conditions. K-means clustering was performed on the first 20 principal components (PCs) of the regulon activity matrix with cluster number k = 7. Each cell is assigned the color of its K-means cluster.
g, Confusion matrix showing the percentage overlap of Seurat transcriptome-based clusters with K-means regulon-based clusters.
h, Heatmap of the t-values of regulon activity derived from a generalized linear model of the difference between cells from one neutrophil subpopulation and cells from other non-neutrophil populations. Only regulons with at least one absolute t-value >100 are visualized. Previously uncharacterized neutrophil-specific transcription factors are marked in red with binding motif shown on the right.
i, Activities of the four newly identified neutrophil-specific regulons.
j, As in (H), but t-values representing activity change between the current developmental stage and the previous one. Only regulons with at least one absolute t-value >40 are visualized. Regulons are hierarchically clustered based on activation pattern (red and orange: early-activated, yellow: G3-inactivated, green: late-activated, blue: global-activated).