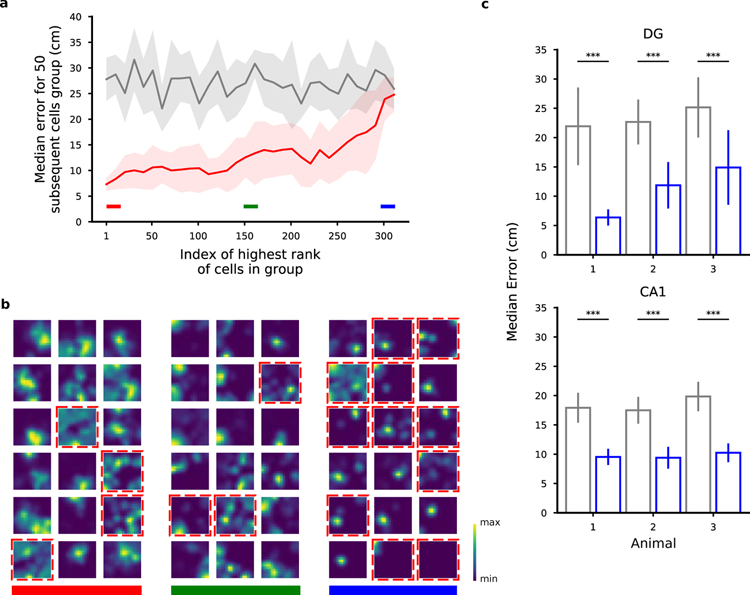
Figure 4.
Ranking neurons according to their contribution to the decoding accuracy for position. a) Validation of the importance index. In this figure we show the median error for various selections of 50 DG cells from a representative animal ranked by their importance index as obtained using the decoder’s weight. Each point in the plot is aligned to the rank of the first cell in the selection (for example, the first dot corresponds to the selection of the first 50 cells from index 1 to index 50; the shaded region represents the standard error for the 10-fold cross-validation). Grey: chance level and standard error. As expected, the median error for the population of the 50 top ranked (best) cells is much smaller than the median error for the worst last (worst) 50 ones. b) Spatial tuning maps for groups of 18 cells ordered by importance index. Same cells as in a. We ranked the cells using the importance index for position (see Methods). The three groups of best, mid and worst cells are highlighted with the color bands in a for reference. The maps are normalized to the peak rate in each map. Dashed red borders indicate cells that don’t pass the criteria for place-cells using a commonly used statistical test for tuning (see Methods). Even among the most important cells there appear some non place-cells (and vice versa). Similarly, some place cells appear in the group of cells with medium and low importance. The small fields in the group of low importance cells are due to significantly lower activities (see also Fig. 5). c) The position of both DG and CA1 animals can be decoded from the activity of the non-place cells with a performance significantly higher than chance (Mann-Whitney U test, ***p < 0.001). Number of cells: 451, 208, 98 in DG mice; 350, 277, 198 in CA1 mice. See also Fig. S2, S3, S8, S10, S24 and Table S1.

