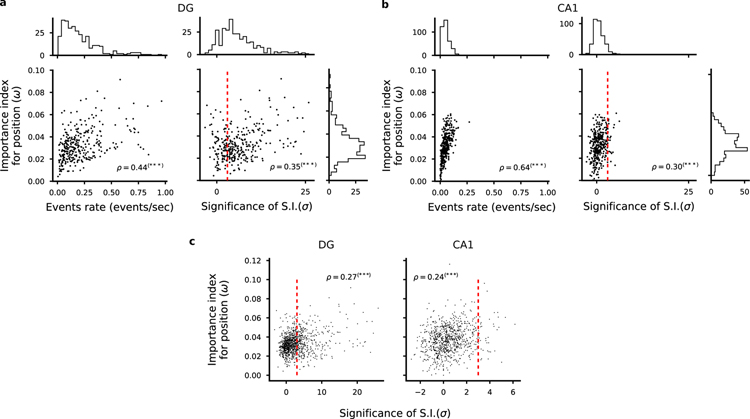
Figure 5.
Correlation between importance index and spatial information. a-b) Left: Scatter plot of importance index and overall cell activity for each cell in one representative animal. As expected, we found a strong correlation between these quantities because it is unlikely that a weakly active cell can contribute to decoding. Right: Scatter plot of importance index and statistical significance of spatial information with respect to independent random temporal shuffling of each cell’s identified calcium events. DG cells in a, CA1 cells in b. Each dot corresponds to one cell in one representative animal. Pearson’s correlation factor ρ between the plotted quantities are reported (***p < 0.001). Significant correlations are found between the analysed quantities but single cell statistics only partially capture the information available at the population level. For each quantity, overall histograms are reported on the side of the plot. The dashed red line corresponds to a value of a threshold of 3 used to define place cells (see Methods). c) Same plots as in a and b but for all cells identified in all FOVs in DG (left) and CA1 (right). See also Fig. S9, S13.

