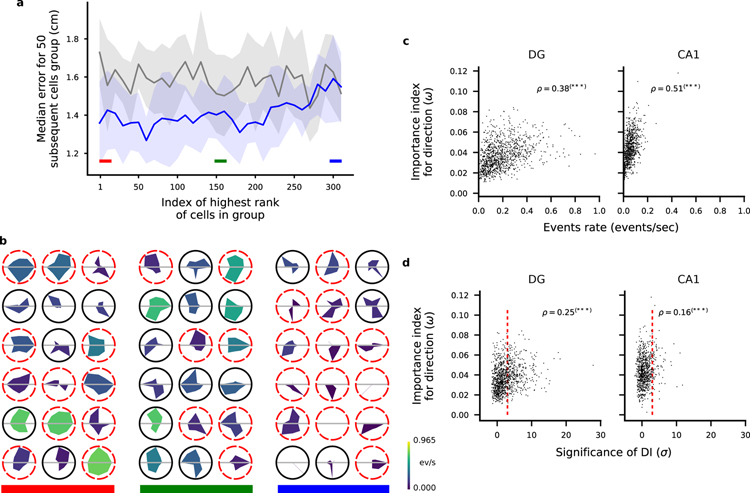
Figure 6.
Ranking neurons according to their contribution to the decoding accuracy for head direction. a) Validation of the importance index as in Fig. 4a but we ranked the cells according to the importance index for decoding direction of motion (see Methods). b) Tuning maps as in Fig. 4b. Here we show the tuning for direction of motion of single cells as polar tuning maps for groups of 18 cells ordered by importance index. The area colour represents the overall activity of the cell throughout the trial. Dashed red borders indicate cells that don’t pass the criteria for significant direction tuning using a commonly used statistical test (see Methods). As in the case of position tuning, some untuned cells appear among the most important cells and highly tuned cells appear among the least important. c) Scatter plots of cell activity and importance for position decoding for all identified cells combined from all FOVs in DG (left) and CA1 (right). Pearson correlation factor ρ between the plotted quantities are reported (***p < 0.001). d) Same as in c but for importance index for direction and significance of direction information.

