
Extended Data Figure 9. Binding of the monoclonal antibodies to the RBD of SARS-CoV-2 and cross-reactivity to SARS-CoV.
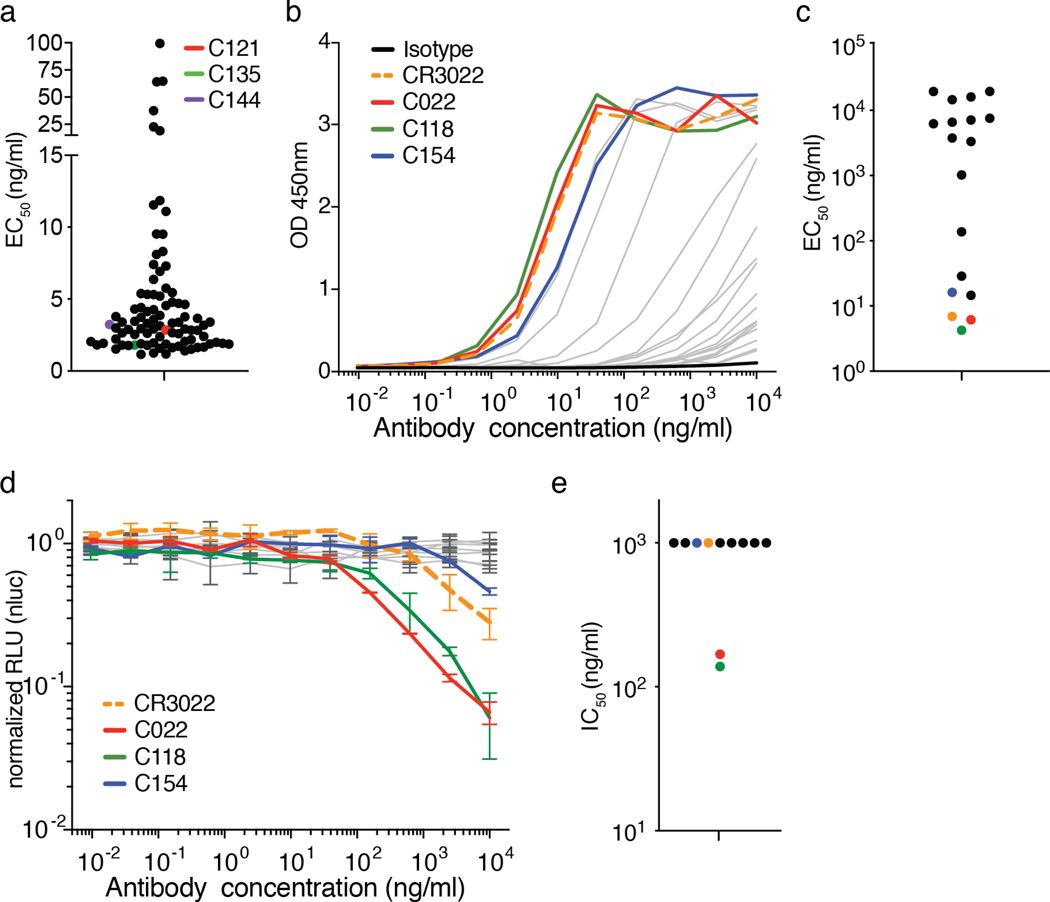
a, EC50 values for binding to the RBD of SARS-CoV-2. Average of two or more experiments; n=89. b and c, Binding curves and EC50 values (average of two experiments) for binding to the RBD of SARS-CoV; n=20 and n=17 (excluding isotype and CR3022), respectively. d and e, SARS-CoV pseudovirus neutralization curves and IC50 values. Shown in d are the standard deviations of duplicates for one representative experiment and in e is the average of two experiments (n=10, excluding CR3022). Samples with IC50s above 1μg/ml were plotted at 1μg/ml.