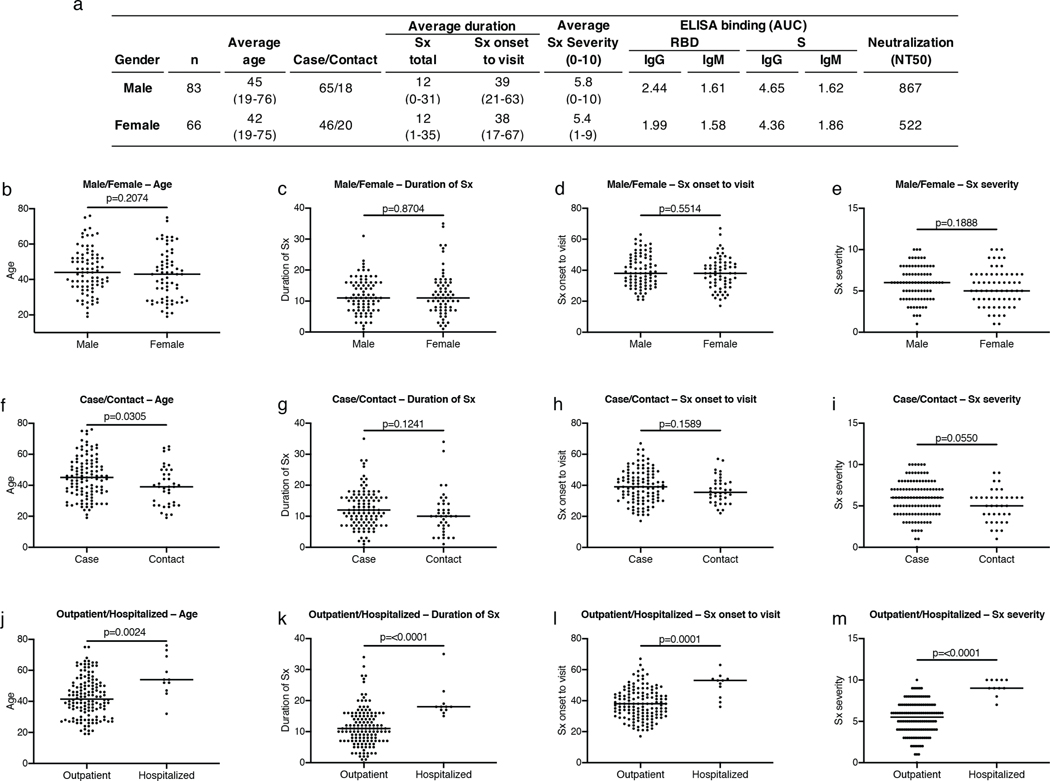
Extended Data Figure 1. Clinical correlates.

a, Summary of the cohort’s characteristics. b, Age distribution (Y axis) for all males (n=83) and females (n=66) in the cohort; p=0.2074. c, Duration of symptoms in days (Y axis) for all males (n=83) and females (n=66) in the cohort; p=0.8704. d, Time between symptom onset and plasma collection (Y axis) for all males (n=83) and females (n=66) in the cohort; p=0.5514. e, Subjective symptom severity on a scale of 0–10 (Y axis) for all males (n=83) and females (n=66) in the cohort; p=0.1888. f, Age distribution (Y axis) for all cases (n=111) and contacts (n=38) in the cohort; p=0.0305. g, Duration of symptoms in days (Y axis) for all cases (n=111) and contacts (n=38) in the cohort; p=0.1241. h, Time between symptom onset and plasma collection in days (Y axis) for all cases (n=111) and contacts (n=38) in the cohort; p=0.1589. i, Symptom severity (Y axis) for all cases (n=111) and contacts (n=38) in the cohort; p=0.0550. j, Age distribution (Y axis) for all outpatient (n=138) and hospitalized (n=11) participants; p=0.0024. k, Duration of symptoms in days (Y axis) for all outpatient (n=138) and hospitalized (n=11) participants in the cohort; p=<0.0001. l, Time between symptom onset and plasma collection in days (Y axis) for all outpatient (n=138) and hospitalized (n=11) participants in the cohort; p=0.0001. m, Symptom severity (Y axis) for all outpatient (n=138) and hospitalized (n=11) participants in the cohort; p=<0.0001. Horizontal bars indicate median values. Statistical significance was determined using two-tailed Mann-Whitney U test.
