
Extended Data Figure 2. Clinical correlates of plasma antibody titers.
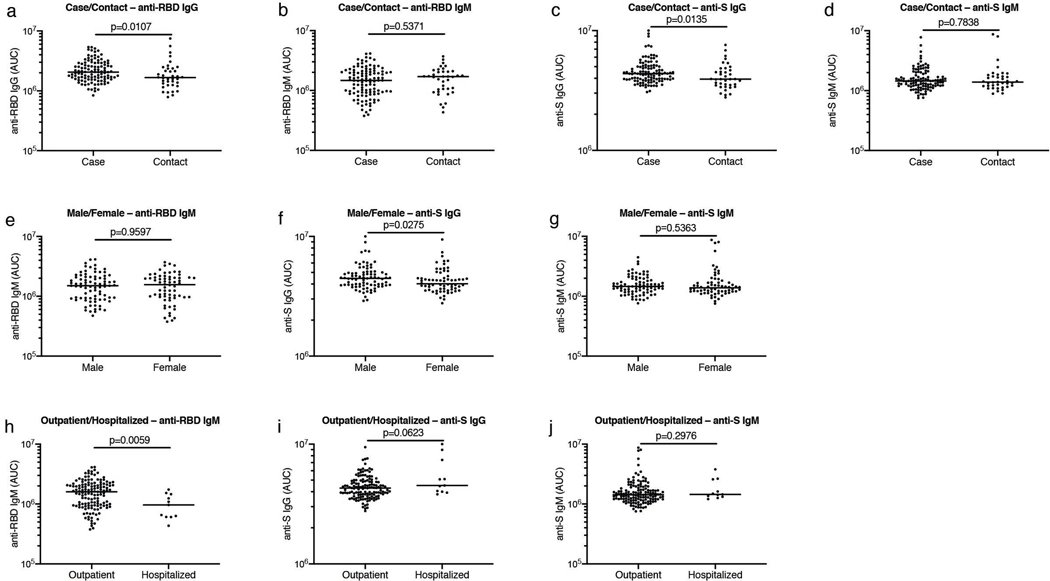
a, Normalized AUC for IgG anti-RBD (Y axis) for all cases (n=111) and contacts (n=38) in the cohort; p=0.0107. b, Normalized AUC for IgM anti-RBD (Y axis) for all cases (n=111) and contacts (n=38) in the cohort; p=0.5371. c, Normalized AUC for IgG anti-S (Y axis) for all cases (n=111) and contacts (n=38) in the cohort; p=0.0135. d, Normalized AUC for IgM anti-S (Y axis) for all cases (n=111) and contacts (n=38) in the cohort; p=0.7838. e, Normalized AUC for IgM anti-RBD (Y axis) for all males (n=83) and females (n=66) in the cohort; p=0.9597. f, Normalized AUC for IgG anti-S (Y axis) for all males (n=83) and females (n=66) in the cohort; p=0.0275. g, Normalized AUC for IgM anti-S (Y axis) for all males (n=83) and females (n=66) in the cohort; p=0.5363. h, Normalized AUC for IgM anti-RBD (Y axis) for all outpatient (=138) and hospitalized (n=11) participants in the cohort; p=0.0059. i, Normalized AUC for IgG anti-S (Y axis) for all outpatient (=138) and hospitalized (=11) participants in the cohort; p=0.0623. j, Normalized AUC for IgM anti-S (Y axis) for all outpatient (=138) and hospitalized (=11) participants in the cohort; p=0.2976. Horizontal bars indicate median values. Statistical significance was determined using two-tailed Mann-Whitney U test.