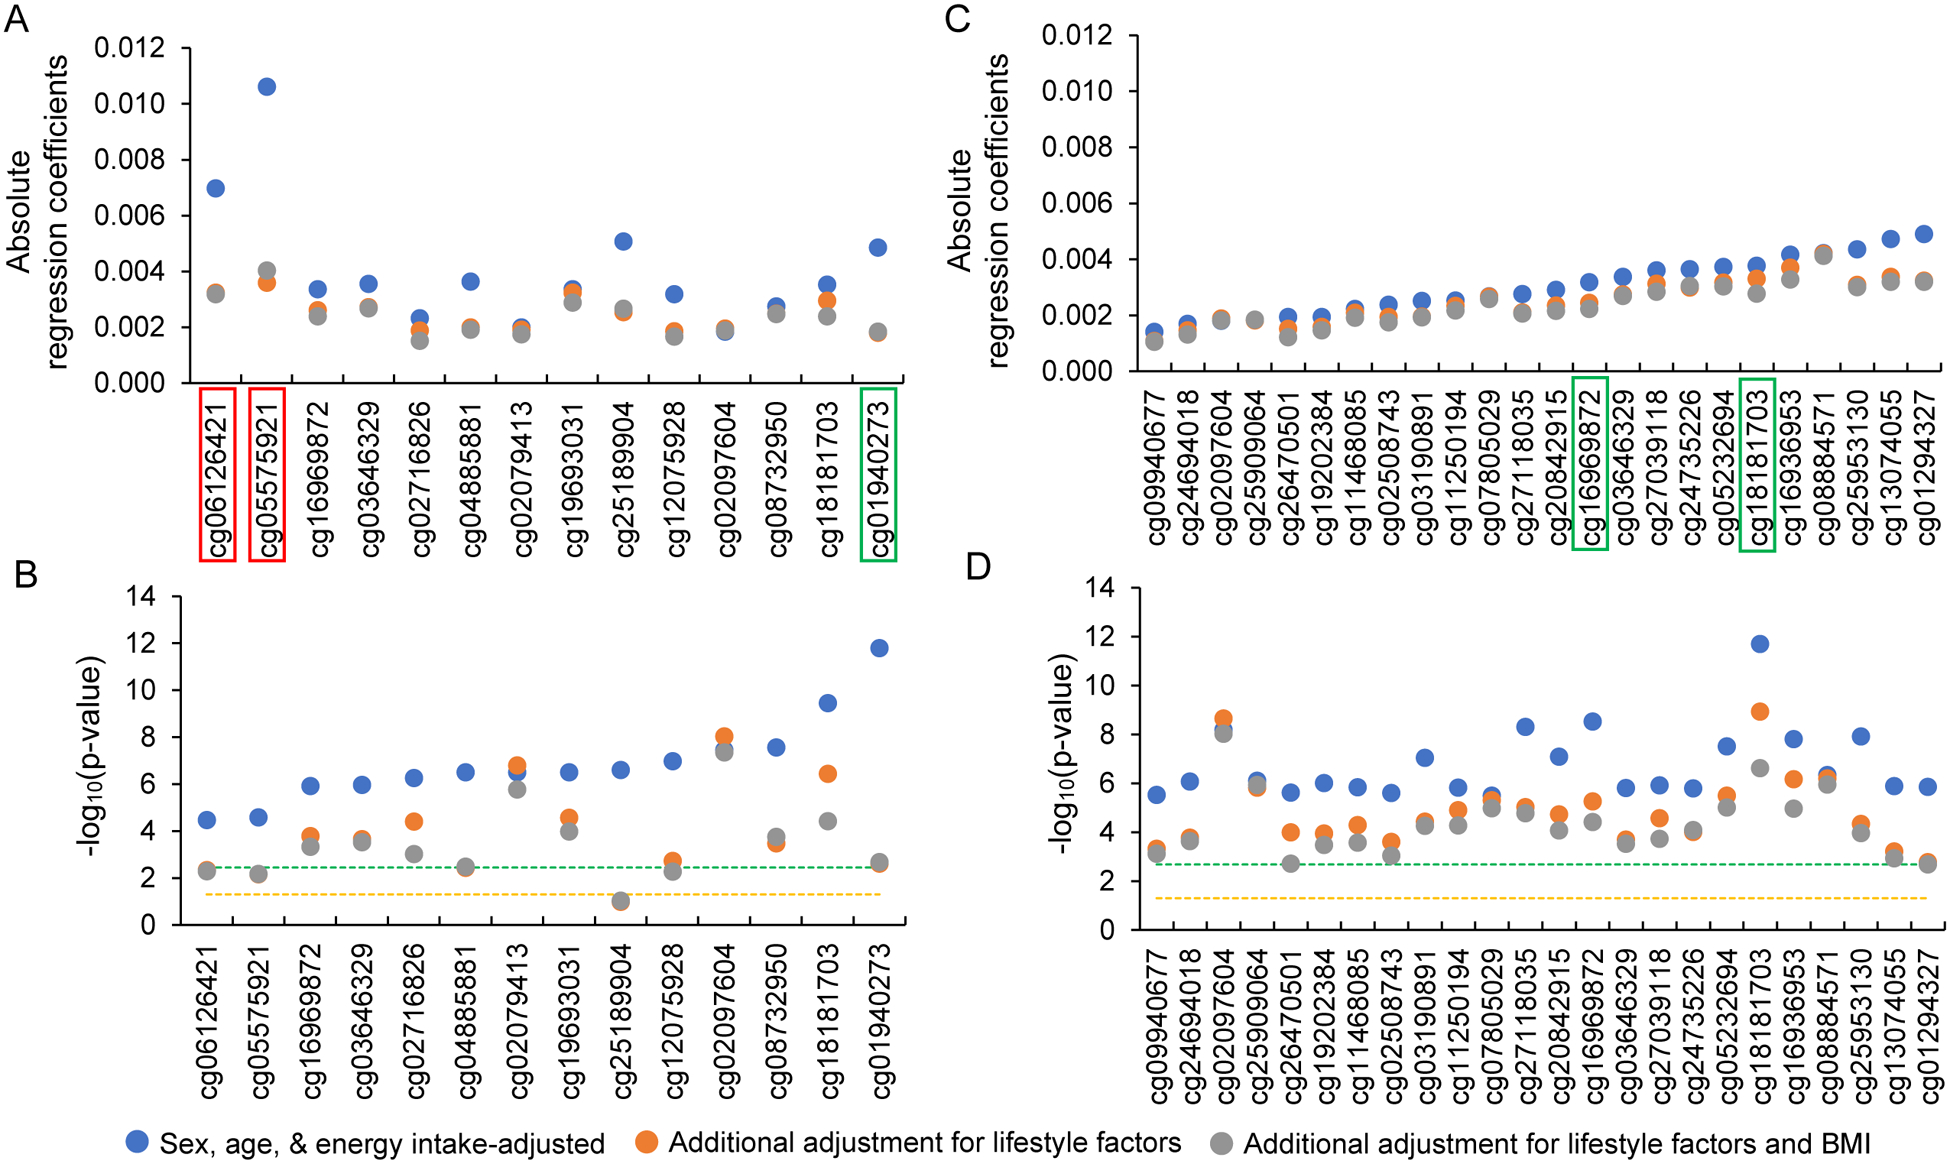
Figure 2.

Effect of additional adjustment for lifestyle factors (smoking and physical activity) and BMI in European ancestry participants. A and B are 14 CpGs identified using the Mediterranean-style diet score (MDS). C and D are 24 CpGs identified using the Alternative Healthy Eating Index (AHEI). CpGs highlighted in red-colored rectangle are those identified in the two-step analysis alone and CpGs highlighted in green-colored rectangle are those identified in both one-step and two-step analyses. Orange colored dash line represents -log10 of 0.05 and green colored dash line represents -log10 of Bonferroni corrected p-value threshold, i.e., 0.05/14 for MDS and 0.05/24 for AHEI. Four CpGs (cg05575921, cg06126421, cg12075928, and cg25189904) in MDS analysis became non-significant after Bonferroni correction in models with adjustment for lifestyle factors and BMI, whereas all 24 CpGs in AHEI analysis remained significant.
