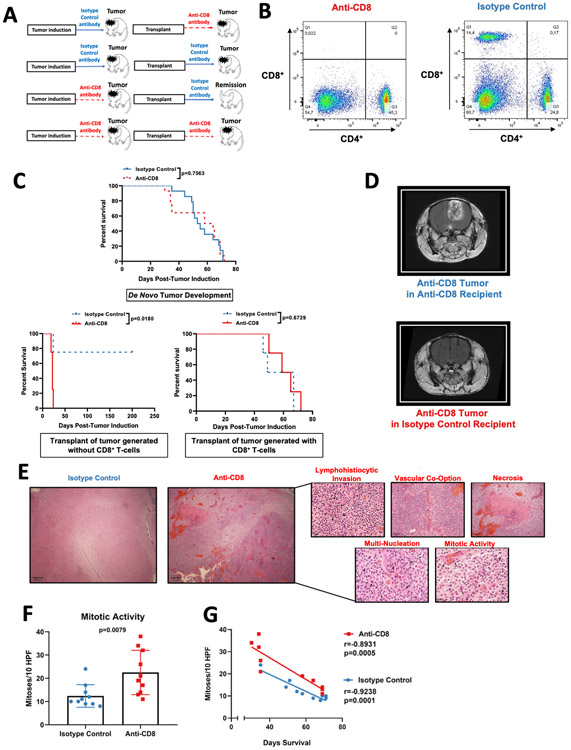
Figure 1: Gliomas that develop in the absence of CD8+ T-cells are more immunogenic yet display increased oncogenic features.
(A) Scheme of the experimental design to investigate glioma immunoediting. Mice were treated with either Isotype control antibody or anti-CD8+ T cell antibody prior to the injection of the PDGF+-IRES-Cre retrovirus, and throughout tumor development. Tumors were harvested and used to create primary cultures. These cell lines were intracranially implanted into recipients treated with either anti-CD8+ antibody or Isotype control antibody prior tumor implantation, and until death (B) Representative flow cytometry dot-plots of CD4+ and CD8+ T cells in the spleen after administration of anti-CD8+ antibody and the isotype control antibody. (C) Kaplan-Meier plots of animals treated with anti-CD8+ and isotype control antibodies prior to and during de novo tumor formation (n=28) (top). Kaplan-Meier plot of animals that received the transplant of glioma originated in a host treated with anti-CD8+ antibody (depleted of CD8+ T-cells) (n=8) (bottom left). Kaplan-Meier plot of animals that received the transplant of glioma originated in a host treated with the Isotype control antibody (immunocompetent host for tumor the de novo tumor formation) (n=8) (bottom right) (D) Representative MRI of mice implanted with gliomas generated in the absence of CD8+ T-cell. (E) Histopathological micrographs with H&E staining in tumors from mice treated with isotype control and anti-CD8+ antibodies. (F) Bar plot showing mitotic figures identified per 10 high-powered fields (HPFs) compared between tumors treated with the anti-CD8+ and isotype control antibody (n=20). (G) Scatter plot showing the correlation between mitotic activity and survival from mice treated with isotype control and anti-CD8+ antibodies. p=0.7563 and p=0.0180 in (C), Log rank test. Data in (F) are shown as mean ± SEM, unpaired student´s t-test. Points represent individual mice. r=−0.8931, p=0.0005 (anti-CD8+); r=−0.9238, p=0.0001 (isotype control) in (G), Pearson correlation coefficient.

