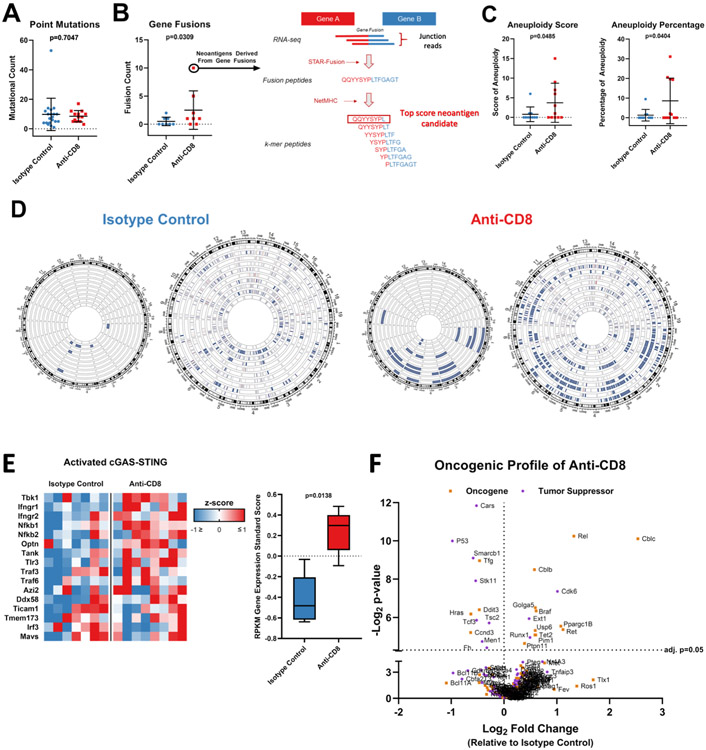
Figure 2: Loss of CD8+ T-cells during glioma formation is associated with increase in tumor genomic instability.
(A) Bee swarm plots showing the number of point mutations (n=33) and (B) gene fusions (n=16) compared between tumors from animals treated with anti-CD8+ and isotype control antibodies. Predicted neoantigens derived from gene fusions with high binding affinity to H2-Kb and H2-Db are shown via schematic representation of the neoantigen prediction pipeline in the right. (C) Bee swarm plots showing the aneuploidy score (n=21) (left) and percentage of aneuploidy across the genome (n=21) (right) compared between tumors from animals treated with anti-CD8+ and isotype control antibodies. (D) Circos plot showing the chromosomal losses and amplifications compared between tumors from animals treated with anti-CD8+ and isotype control antibodies (n=21; p=0.034). Each wheel represents a track of a tumor for the copy number variation analysis. Blue represents deletion while red represents amplification. The left schematic of each panel depicts only deep copy number variations while the right also depicts shallow variations. (E) Heatmap and box plot of the gene expression of the cGAS-STING signaling. The RPKM z-score of genes involved in cGAS-STING signaling is compared between tumors developed in the absence of CD8+ T-cells and the isotype control (n=15). (F) Volcano plots show the relative expression of all oncogenes and tumor suppressors as plotted by their RPKM log2 fold change versus adjusted p-value= 0.05 by differential expression analysis in each group. Data in (A-C, E) are shown as mean ± SEM, p values in (A and C) by student´s t test, p value in (B) by Mann Whitney U test. Points in (A-C) represent individual mice. p=0.0138 in (E), two-way ANOVA.

