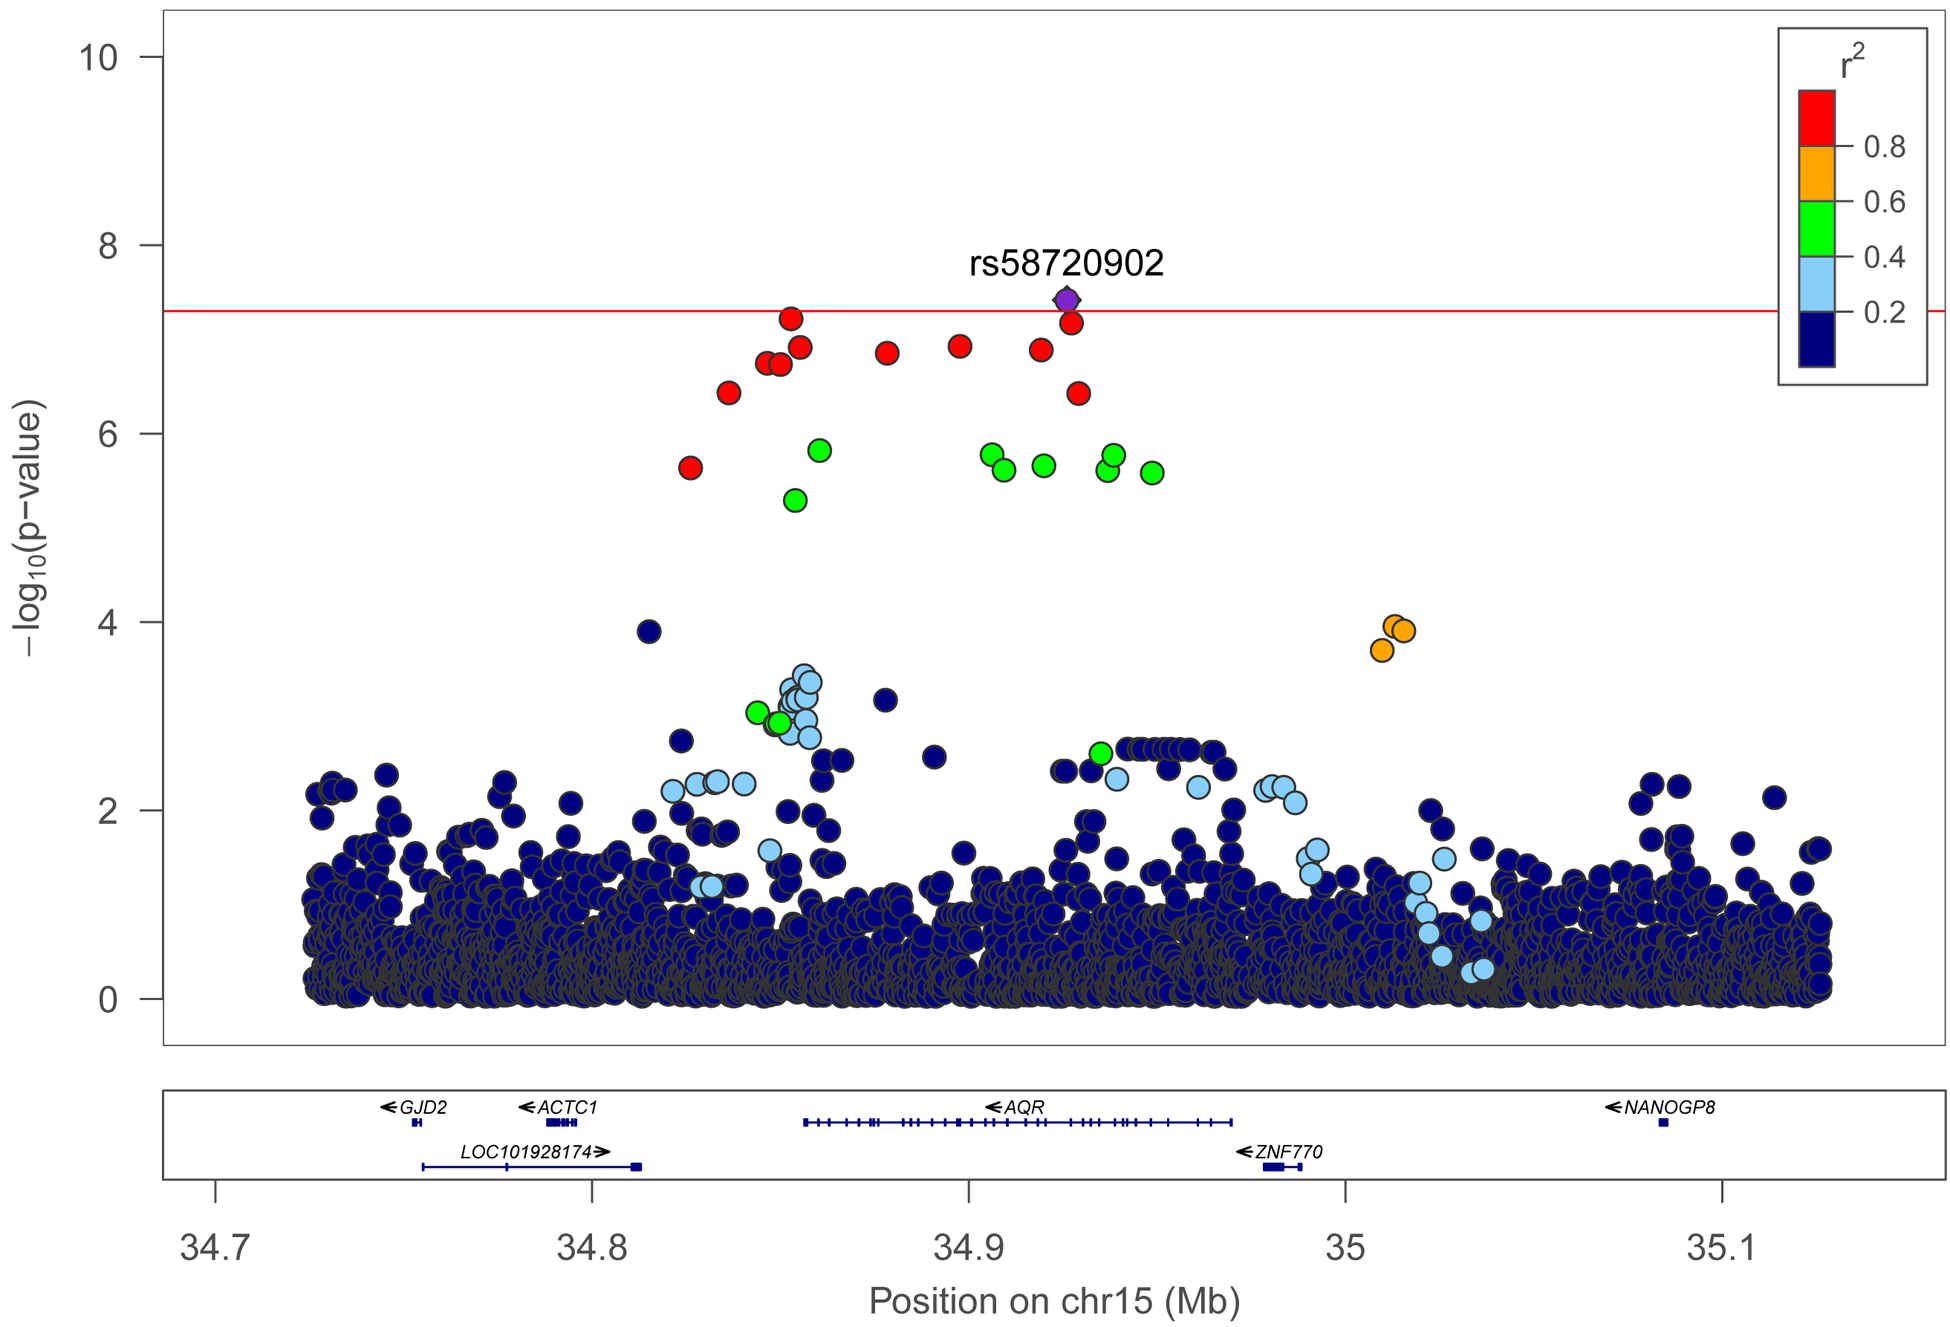
Figure 1.


Regional plot for associations at the AQR gene on chromosome 15 for eGFR (A), and association at the ZBTB16 gene for ACR (B) in the HCHS/SOL discovery samples. X-axis shows the chromosome position and underlying genes in the region. The y-axis is the –log (p-values). Each dot is a SNV and the color indicates linkage disequilibrium (r2) with the best variant (in purple). Red horizontal line is the genome-wide association threshold.
