
Fig. 2 |. YTHDF proteins promote SG formation.
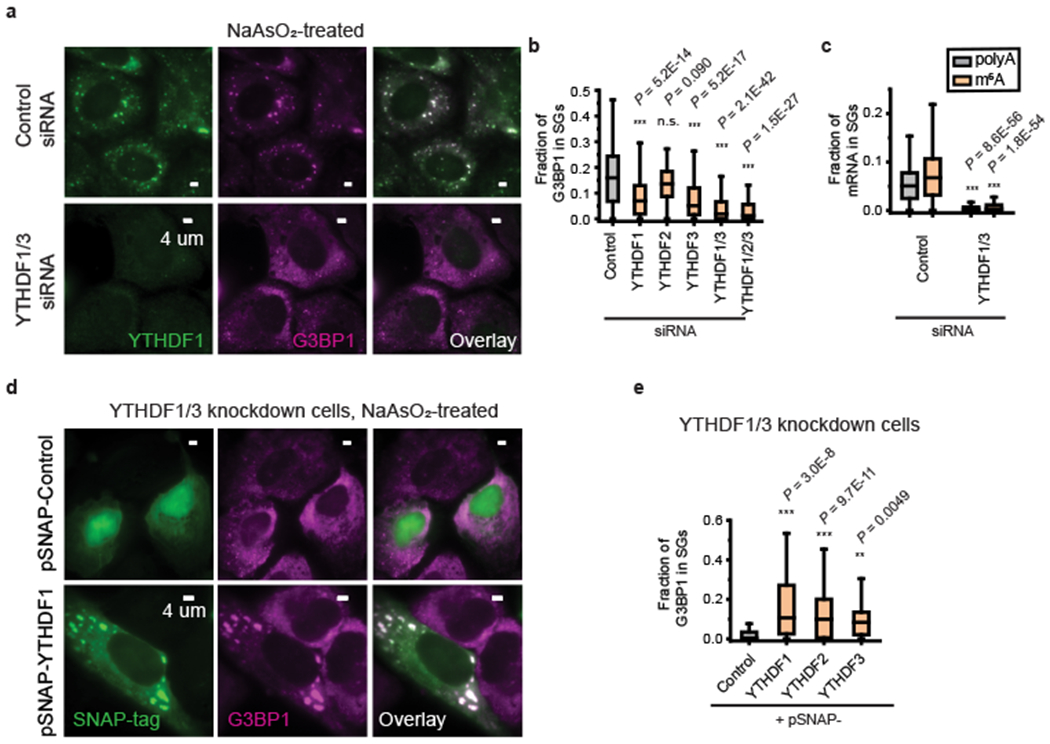
a, Two-color immunofluorescence images of YTHDF1 and G3BP1 show the disappearance of large SGs upon YTHDF1 and YTHDF3 double siRNA knockdown. The upper panels show the images for cells treated with control (scrambled) siRNA and the lower panels show the images of the YTHDF1/3 double knockdown cells. Images are representative examples from three independent experiments. b, Quantification of the fraction of G3BP1 in SGs for U-2 OS cells treated by control siRNA, single knockdown cells treated with YTHDF1, YTHDF2 or YTHDF3 siRNA, YTHDF1/3 double knockdown cells, and YTHDF1/2/3 triple knockdown cells. Oxidative stress in these cells was induced by 0.5 mM NaAsO2 treatment for 30 min. n = 234 cells (control siRNA), n = 242 cells (YTHDF1 siRNA), n = 111 cells (YTHDF2 siRNA), n = 204 cells (YTHDF3 siRNA), n = 357 cells (YTHDF1/3 siRNA), n = 118 (YTHDF1/2/3 siRNA), from 3 independent experiments each. c, Fraction of polyA (black) and m6A (orange) signals in SGs in cells treated with control siRNA as well as in YTHDF1/3 double knockdown cells. n = 256 cells (control siRNA), n = 203 cells (YTHDF1/3 siRNA), from 3 independent experiments each. d,e, Overexpression of full-length YTHDF1, YTHDF2, and YTHDF3 proteins rescues the SG formation in YTHDF1/3 knockdown cells. All constructs are tagged with SNAP at the C-terminal end. Overexpressed proteins were imaged using a fluorescent dye that labels the SNAP-tag. d, Two-color images of SNAP-tag, detected by dye molecules conjugated to SNAP, and G3BP1, detected by immunofluorescence, for cells expressing a control SNAP-tag plasmid that does not contain YTHDF (upper panels) and for cells expressing SNAP-YTHDF1 (lower panels). Cells were treated by 0.5 mM NaAsO2 for 25 min to induce oxidative stress. Images are representative examples from three independent experiments. e, Quantification of the fraction of G3BP1 in SGs for YTHDF1/3 double knockdown cells overexpressing the control SNAP-tag, and for YTHDF1/3 double knockdown cells overexpressing SNAP-YTHDF1, SNAP-YTHDF2 or SNAP-YTHDF3. n = 125 cells (Control), n = 46 cells (YTHDF1), n = 156 cells (YTHDF2), n = 12 cells (YTHDF3), from 3 independent experiments each. For b,c,e, the boxplots show the median (middle lines), 25%-75% quartiles (boxes), and Tukey-style whiskers extend to the most extreme datapoint within 1.5 × interquartile ranges (IQR) beyond the box. P values were determined by comparing with controls; Unpaired Mann–Whitney U test, two-sided.