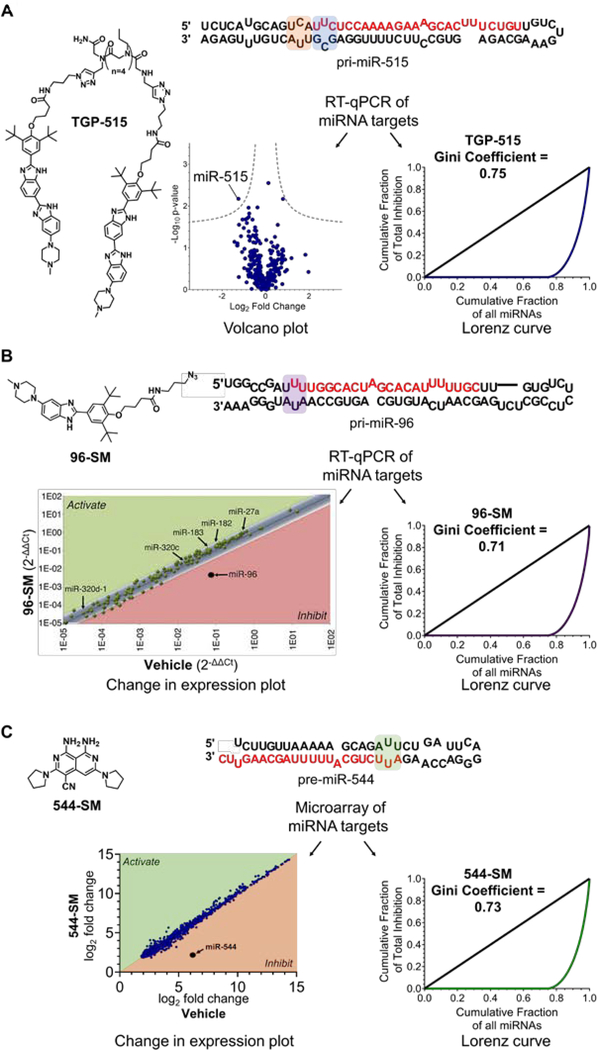
Figure 2.
Application of Gini coefficients to quantify the cellular selectivity of SMIRNAs. A) Selectivity of TGP-515 (1 μM, the IC50) in MCF-7 cells generated from RT-qPCR profiling data as shown by the Volcano plot (left panel) and the Lorenz curve (right panel). TGP-515 binds to adjacent loops (highlighted in orange and blue) near the Drosha processing site of pri-miR-515. B) Selectivity of 96-SM (40 μM, the IC50) in MCF-7 cells via change in expression plot (left panel) and Lorenz curve (right panel) generated from RT-qPCR profiling data. 96-SM binds to an internal loop in the Drosha processing site of pri-miR-96 (highlighted in purple). C) Selectivity of 544-SM (0.02 μM, the IC80) in MDA-MB-231 triple negative breast cancer cells via change in expression plot (left panel) and Lorenz curve (right panel) generated from microarray profiling data. 544-SM binds to an internal loop in the Dicer processing site of pre-miR-544 (highlighted in green).

