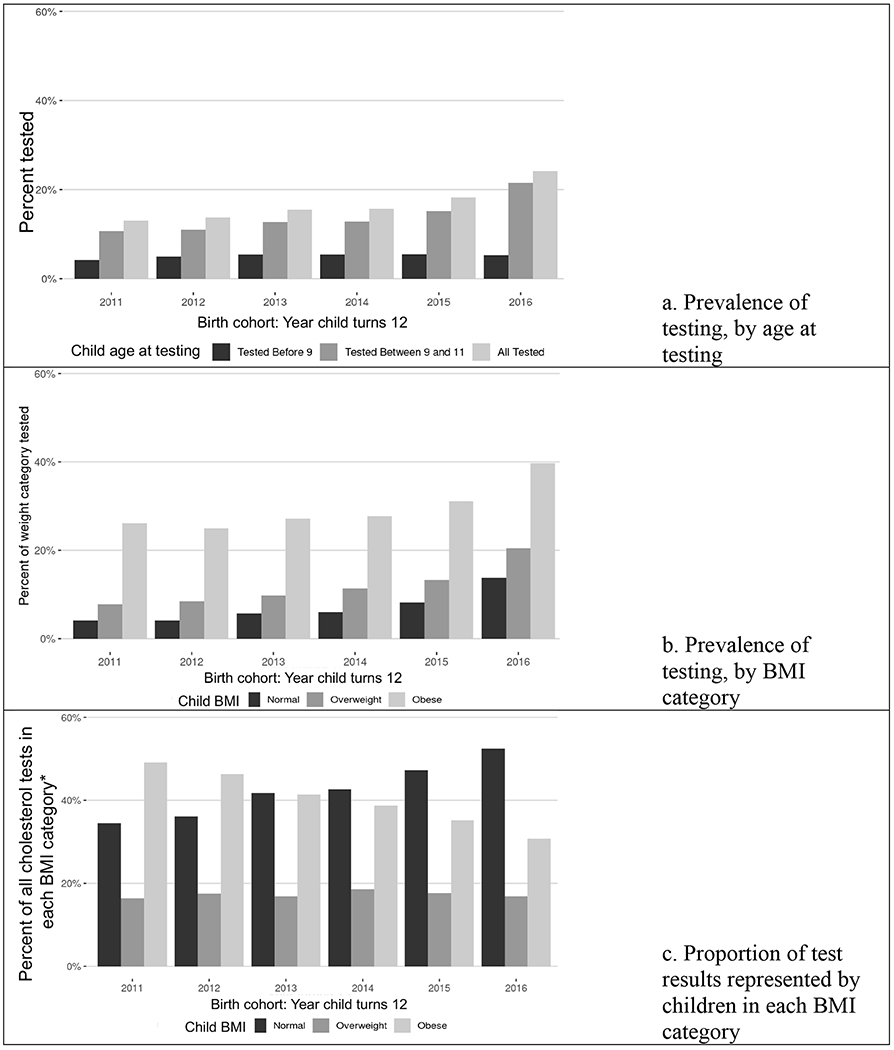
Figure 1:

Cholesterol testing by age 12 by birth cohort (year child turns 12)
Note: Figures 1a and 1b show percent of all included children, whereas Figure C focuses on the BMI distribution within total 9 – 11 year cholesterol tests for that birth cohort. Figures 1b and 1c exclude children tested at age 7 – 8 years.
* For each year, total percent of tests across birth cohorts adds to 100%.
