
Extended Data Fig. 5: Absolute and relative concentrations of key metabolites in a shift from glucose to acetate.
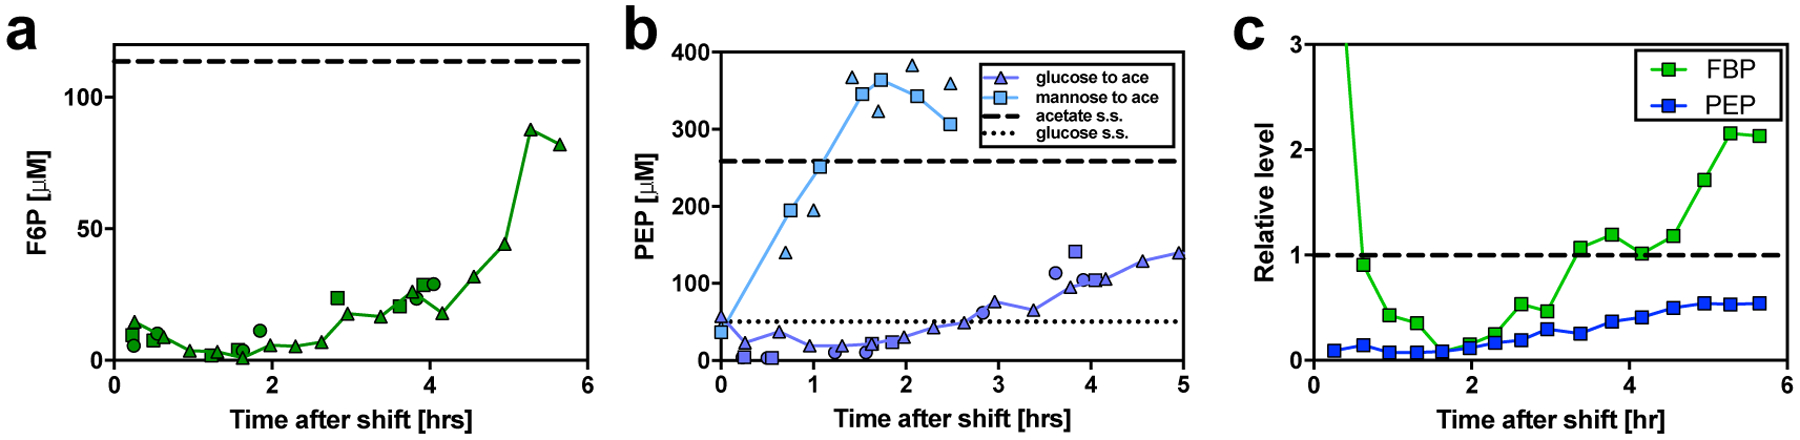
a, Intracellular concentration of F6P the 3 biological repeats of the shift from glucose to acetate presented in Fig. 2 of the main text. The dashed line represents the steady state level of F6P for growth on acetate. The concentration of F6P is low compared to Michaelis constants of key enzymes Pgi and TktA, which catalyze the first reactions from F6P for the production of essential precursors for biomass production E4P and R5P. b, Intracellular concentration of PEP over the course of lag phase for a shift from glucose to acetate (red symbols) and a shift from mannose to acetate (green symbols). Steady-state concentrations on glucose and acetate are indicated by the dashed lines. PEP is a key repressor of glycolytic flux by inhibiting Pfk29. The concentration of PEP remained low throughout lag phase, even compared to the steady-state concentration on glucose (dotted line), where Pfk is very active. c, Time courses of FBP and PEP concentrations throughout lag phase in a shift from glucose to acetate. Concentrations of FBP and PEP were normalized by their steady-state concentration during exponential growth on acetate. FBP drops from its steady-state level for growth on glucose, which is more than 100-fold higher than the steady-state level on acetate (normalized to 1). PEP remains at very low concentrations and slowly builds up together with FBP 1.5 h after the shift. In the framework of our model, we attribute this phase to the slow increase in gluconeogenic enzymes from protein synthesis.