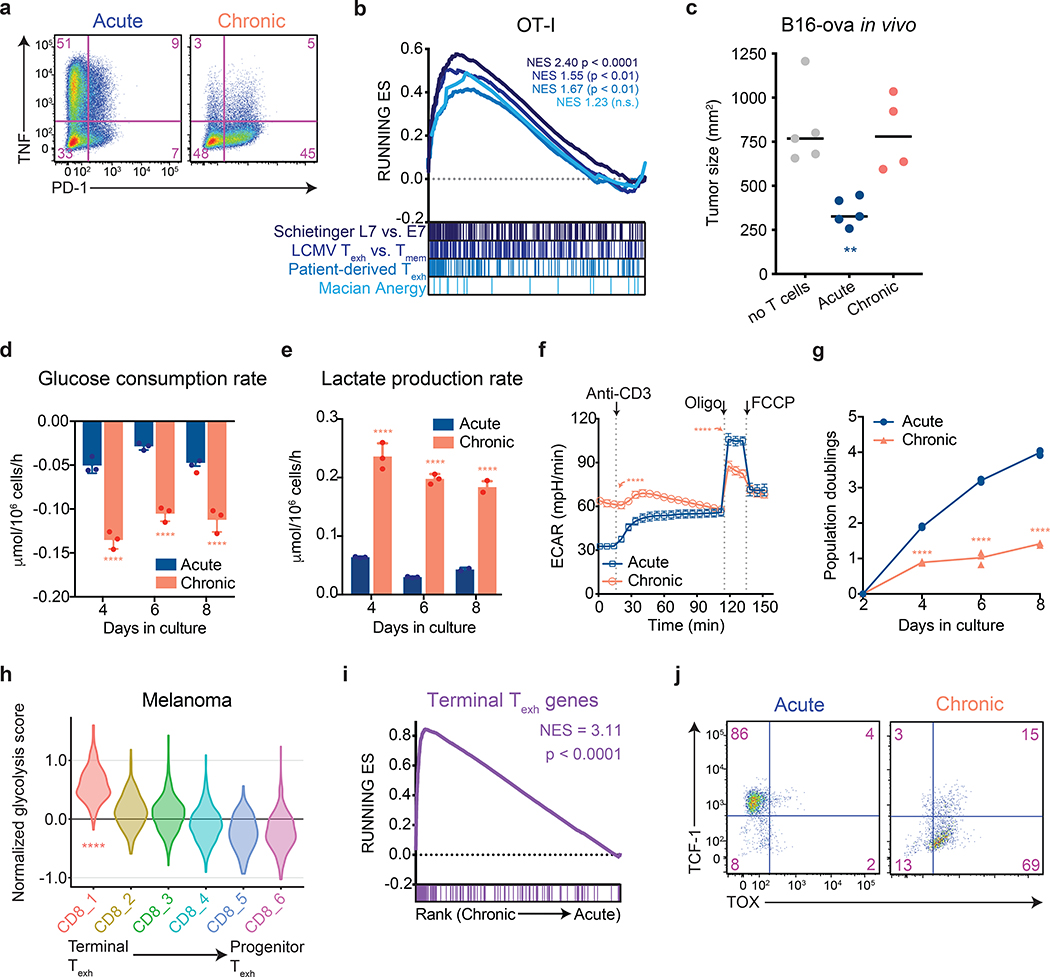
Figure 1. Aerobic glycolysis is a hallmark of terminally exhausted T cells.
All experimental analyses were conducted eight days after initial stimulation unless otherwise specified. (a) PD-1 expression and TNF production by acutely and chronically stimulated T cells upon re-stimulation with PMA and ionomycin. Experiment was repeated three times with similar results. (b) Gene set enrichment plot showing that genes associated with chronically stimulated OT-I T cells in vitro are enriched for genes upregulated in exhausted CD8+ T cells but not anergic T cells. (c) Growth of B16-OVA xenografts. Tumor-bearing mice received no T cells or 1 million acutely or chronically stimulated OT-I T cells by adoptive transfer five days after tumor implantation. Tumor size at 14 days post-implantation is shown. (d-e) Median glucose consumed (d) and lactate excreted (e) in acutely and chronically stimulated T cells following initial stimulation. (f) Extracellular acidification rate (ECAR) of acutely and chronically stimulated polyclonal T cells at baseline, in response to re-stimulation (anti-CD3), or in the presence of ATP synthase inhibition (Oligo) or uncoupling agents (FCCP). (g) Population doublings of acutely and chronically stimulated OT-I T cells following initial stimulation. (h) Normalized expression of glycolytic genes in CD8+ T cell clusters from patients with melanoma treated with immune checkpoint blockade6. (i) Gene set enrichment plot showing that chronically stimulated OT-I T cells in vitro are enriched for genes upregulated in terminal Texh as compared to progenitor Texh8. (j) Flow cytometry plots of acutely and chronically stimulated T cells in vitro demonstrating suppression of TCF-1 and upregulation of TOX in chronically stimulated T cells. P values were calculated by unpaired, two-sided Student’s t-test (c-g) relative to acutely stimulated T cells, based on 1,000 permutations by the GSEA algorithm and not adjusted for multiple comparisons (b,i), or Wilcoxon two-sided rank sum test with Benjamini-Hochberg False Discovery Rate (FDR) correction (h). Data are presented as the mean ± s.d. of n=5 (c), n-4 (f) or n=3 (d,e,g) biologically independent samples from a representative experiment. **P<0.01, ****P<0.0001.

