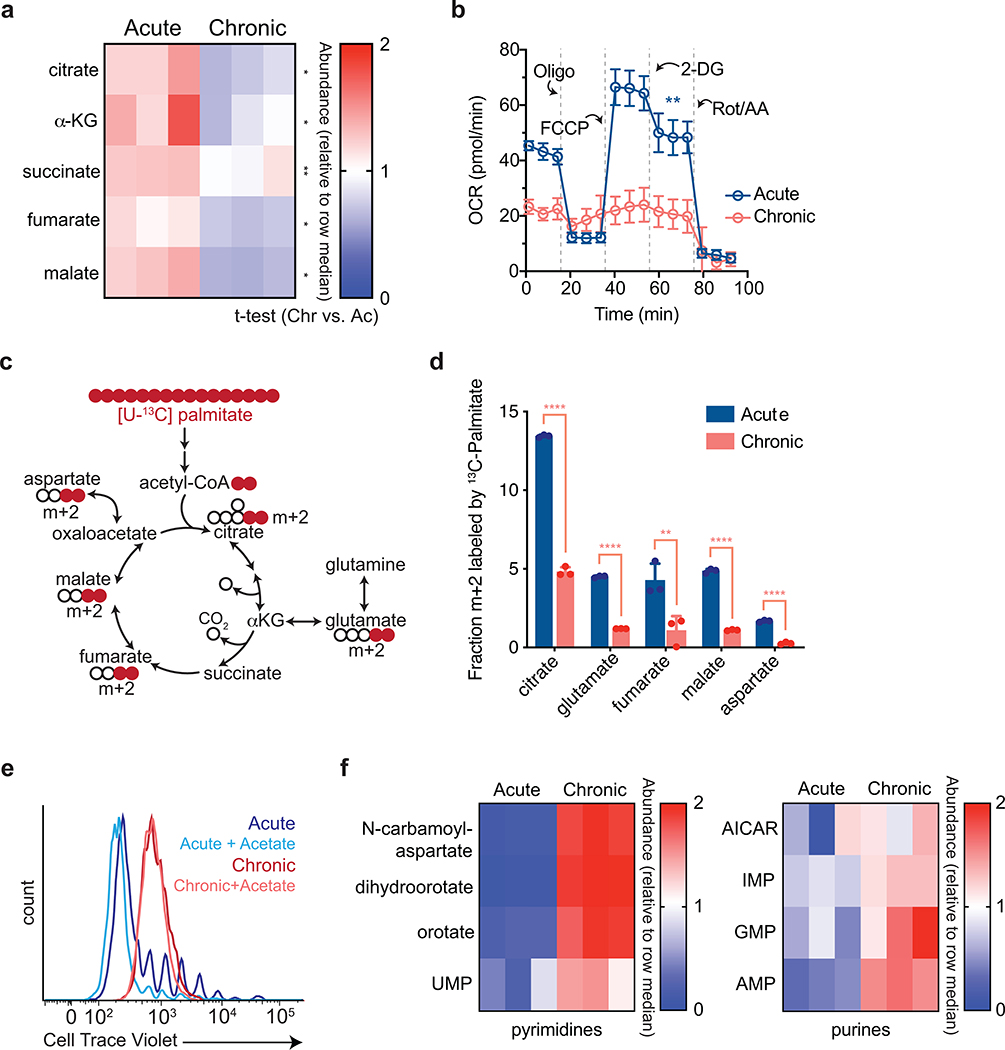
Extended Data Fig. 3. Chronic antigen stimulation impairs mitochondrial oxidation and ATP production.
(a) Quantification of relative tricarboxylic acid cycle metabolite pool sizes in acutely and chronically stimulated T cells. Columns represent biological replicates for each condition. (b) Oxygen consumption rate (OCR) of acutely or chronically stimulated T cells at baseline or in the presence of ATP synthase inhibition (Oligo), uncoupling agents (FCCP), inhibition of glucose uptake (2-DG), and complex III/IV inhibition (Rot/AA). (c) Schematic depicting how oxidative metabolism of uniformly-labeled palmitate ([U-13C] palmitate) generates metabolites associated with the TCA cycle. Colored circles represent 13C-labeled carbons. (d) Fractional labeling by [U-13C] palmitate of citrate, glutamate, fumarate, malate and aspartate in acutely and chronically stimulated T cells following re-stimulation. (e) Proliferation of T cells acutely or chronically stimulated in the presence or absence of supplemental sodium acetate (5 mM), as measured by dilution of Cell Trace Violet fluorescence. (f) Quantification of pool sizes of metabolite intermediates in nucleotide synthesis in acutely and chronically stimulated T cells. Heatmap depicts pool size relative to row median. Columns represent biological replicates for each condition. Experiment was repeated two times with similar results. P values were calculated by unpaired, two-sided Student’s t-test (a,b,d). Data are presented as the mean ± s.d. of n=3 biologically independent samples from a representative experiment. **P<0.01. ****P<0.0001.

