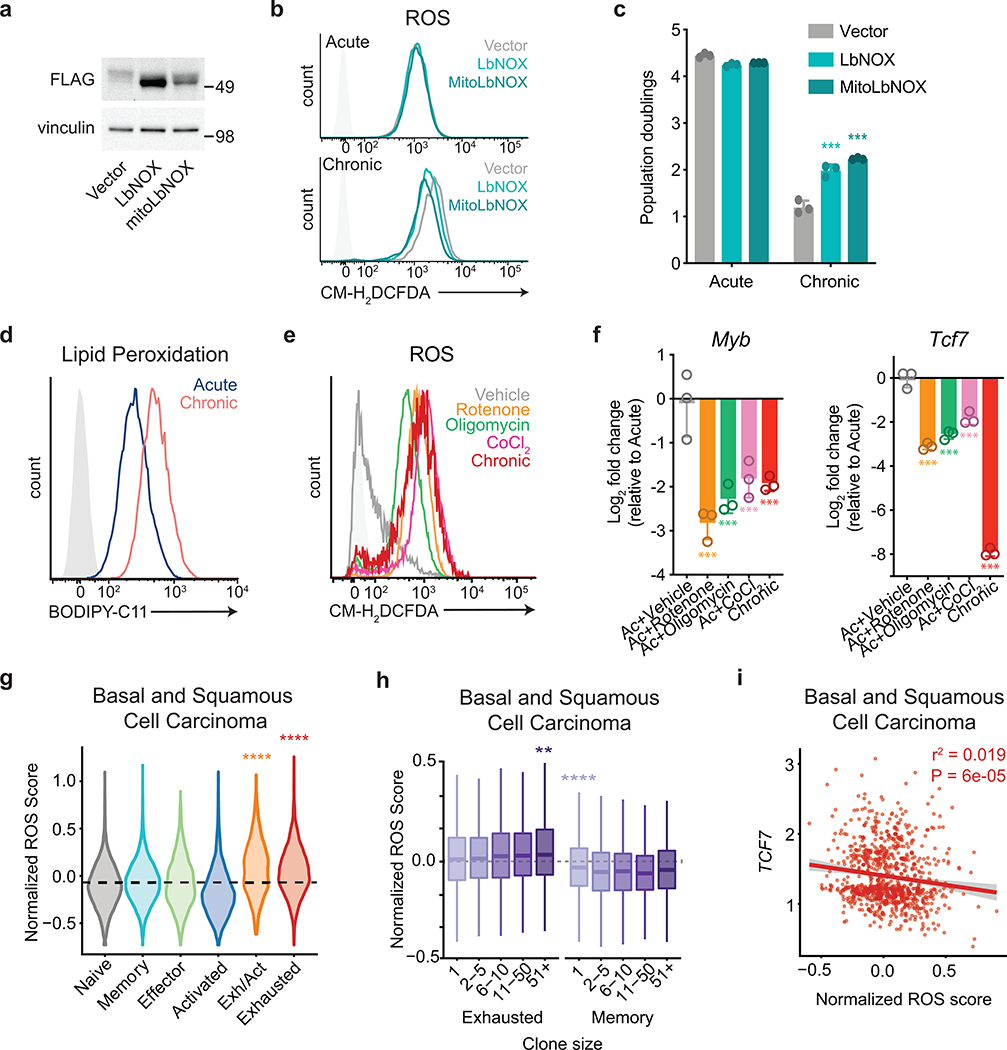
Extended Data Fig. 4. Oxidative stress limits T cell proliferative capacity.
(a) Western blot depicting overexpression of FLAG-tagged recombinant NADH oxidase enzymes LbNOX and MitoLbNOX in T cells30. Experiment was repeated three times with similar results. Uncropped blot can be found within Source Data. (b) Fluorescence intensity of acutely and chronically stimulated T cells expressing vector control, LbNOX, or MitoLbNOX following eight days in culture after loading with CM-H2DCFDA. (c) Population doublings of acutely and chronically stimulated T cells expressing vector control, LbNOX, or MitoLbNOX. (d) Fluorescence intensity of acutely and chronically stimulated T cells after loading with BODIPY-C11 to measure lipid peroxidation. Light-grey-shaded peak represents negative control. (e) Fluorescence intensity of acutely or chronically stimulated T cells cultured with or without pharmacologic agents that impair ETC function following 2 days of initial stimulation. Cells were loaded with CM-H2DCFDA to measure ROS on D8 following initial stimulation. (f) qRT-PCR of Myb and Tcf7 in acutely or chronically stimulated T cells with or without the addition of the indicated agents for 6 days following 2 days of primary stimulation. (g-i) Expression of oxidative stress-related metabolic genes (“ROS score”) in tumor-infiltrating CD8+ T cells from basal and squamous cell carcinoma patients treated with immune checkpoint inhibitors19. In (g), ROS score in independent CD8+ T cell clusters is shown. In (h), ROS score in exhausted and memory T cell populations is shown according to clone size as measured by TCR sequencing; box center line=median, box limits=upper and lower quartiles, box whiskers=1.58 x interquartile range. In (i), correlation of ROS score with TCF7 expression in exhausted CD8+ T cells is shown. Only cells with non-zero TCF7 expression were included. P values were calculated by one-way ANOVA with Sidak’s multiple comparisons post-test (g,i), or one-sided Student’s t-test relative to base mean (g-h). Data are presented as the mean ± s.d. of n=3 biologically independent samples from a representative experiment. **P<0.01. ***P<0.001. ****P<0.0001.

