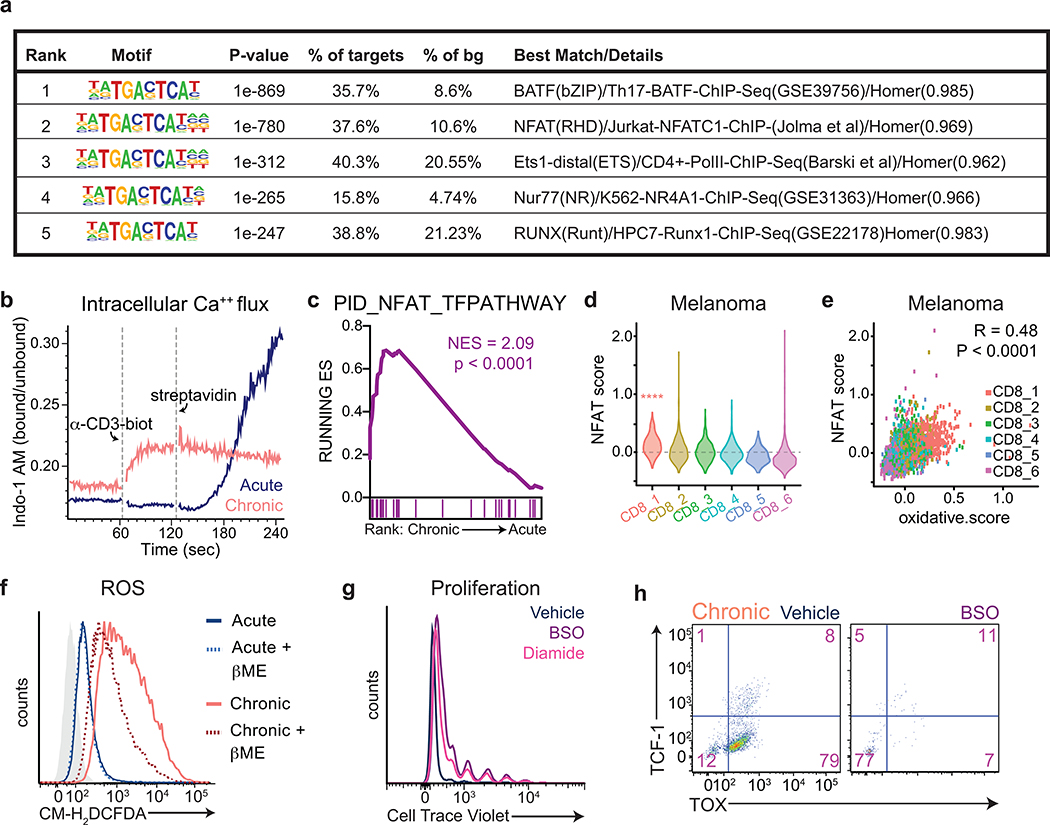
Extended Data Fig. 5. Endogenous antioxidant production is limiting for T cell proliferation.
(a) Motif analysis of sites with increased accessibility in tumor-infiltrating CD8+ T cells (L7) as compared to T cells from Listeria-infected mice (E7) showing NFATc1 as among the motifs whose accessibility was most preferentially increased in L7 cells15. (b) Intracellular calcium flux as measured by ratio of bound to unbound Indo-1-AM in acutely and chronically stimulated T cells, at baseline, in response to monomeric anti-CD3, and in response to receptor clustering (streptavidin). (c) Gene set enrichment plot showing that chronically stimulated OT-I T cells are enriched for NFAT target genes. (d) Expression of NFAT target genes (“nfat score”) in independent CD8+ T cell clusters. (e) Correlation of expression of NFAT target genes (“nfat score”) with expression of oxidative stress-related metabolic genes (“ROS score”) in tumor-infiltrating CD8+ T cells from melanoma patients treated with immune checkpoint inhibitors. (f) Fluorescence intensity of acutely and chronically stimulated T cells cultured with or without βME supplementation after loading with CM-H2DCFDA to measure ROS. Light-grey-shaded peak represents negative control. (g) Proliferation of T cells acutely stimulated in the presence or absence of BSO or diamide as measured by dilution of Cell Trace Violet fluorescence. (h) Expression of TCF-1 and TOX in chronically stimulated T cells cultured in the presence or absence of BSO. P values were calculated by one-sided Student’s t-test relative to base mean (d-e). ****P<0.0001

