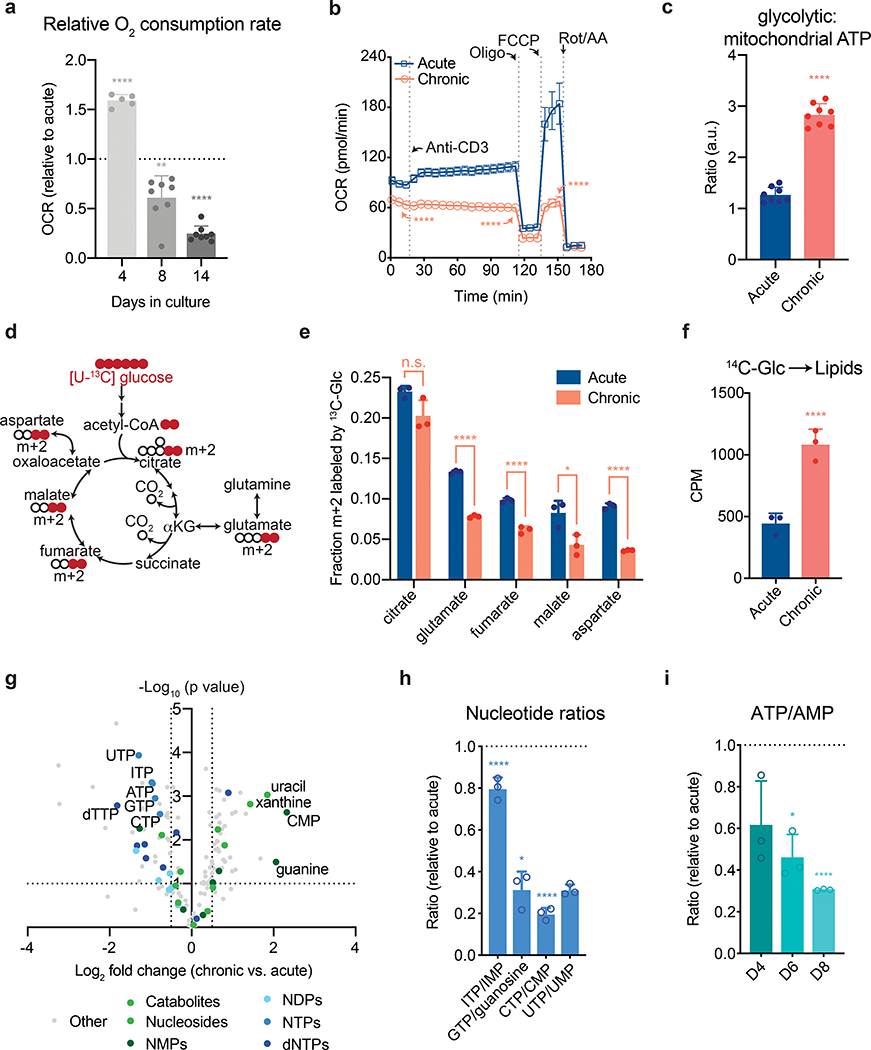
Figure 2. Chronic antigen stimulation induces mitochondrial dysfunction and limits nucleotide biosynthesis.
(a,b) Oxygen consumption rate (OCR) of acutely and chronically stimulated T cells after the indicated days in culture (a) and after 8 days of culture (b) at baseline, in response to re-stimulation (anti-CD3), or in the presence of ATP synthase inhibition (Oligo), uncoupling agents (FCCP), or complex III/IV inhibition (Rot/AA). (c) Ratio of glycolytic to mitochondrial ATP produced by acutely or chronically stimulated cells following re-stimulation with anti-CD3. (d) Schematic depicting how oxidative metabolism of [U-13C] glucose generates metabolites associated with the TCA cycle. Colored circles represent 13C-labeled carbons. (e) Fractional labeling by [U-13C] glucose of citrate, glutamate, fumarate, malate and aspartate in acutely and chronically stimulated T cells following re-stimulation. (f) Labeling of lipids by [U-14C] after 24 h of culture in acutely and chronically stimulated T cells beginning four days after initial stimulation. (g) Quantification of relative metabolite pool sizes in chronically stimulated T cells compared to acutely stimulated T cells. Colored dots represent nucleotides, nucleosides, and nucleoside catabolites as indicated. Dashed lines represent cutoffs of p < 0.01 and log2 fold change > 0.5. (h-i) Quantification of relative nucleotide ratios of chronically stimulated T cells. Dashed line indicates median ratio in acutely stimulated cells. P values were calculated by unpaired, two-sided Student’s t-test (a-c,e-f) or unpaired, two-sided Student’s t-test test with Benjamini-Hochberg False Discovery Rate (FDR) correction (g-i). Data are presented as the mean ± s.d. of n=5 (a), n=8 (a,c), n=4 (b), or n=3 (e,f,h,i) biologically independent samples from a representative experiment. *P<0.05, **P<0.01, ****P<0.0001.

