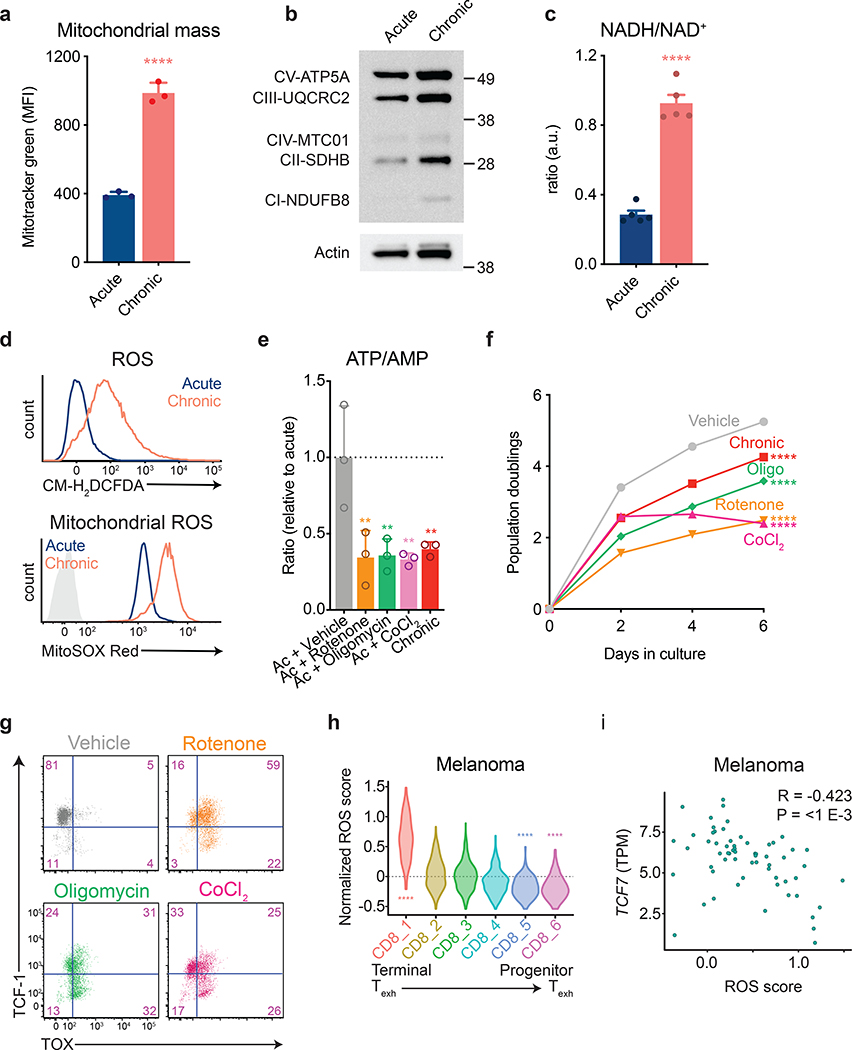
Figure 3. Inhibition of mitochondrial electron transport limits T cell proliferation.
(a) Fluorescence intensity of acutely and chronically stimulated T cells after loading with MitoTracker Green to measure mitochondrial mass. (b) Western blot depicting electron transport chain complex expression in acutely and chronically stimulated T cells. Actin is used as a loading control. Western blot was performed two independent times. Uncropped blot can be found within Source Data. (c) NADH/ NAD+ ratio in acutely and chronically stimulated T cells. Cells were re-stimulated for 30 minutes with anti-CD3 and anti-CD28-coated magnetic beads prior to harvest. Levels were normalized to cell number from duplicate wells. (d) Fluorescence intensity of acutely and chronically stimulated T cells after loading with CM-H2DCFDA (above) or MitoSox Red (below). Light-grey-shaded peak represents negative control. (e) ATP/AMP ratios in acutely stimulated T cells cultured with or without the indicated agents following two days of initial stimulation. Dashed line represents median nucleotide ratios in vehicle-treated T cells. (f-g) Population doublings (f) and expression of TCF-1 and TOX (g) of acutely stimulated T cells with or without the addition of the indicated agents following two days of initial stimulation. (h,i) Expression of oxidative stress-related metabolic genes (“ROS score”) in tumor-infiltrating CD8+ T cell clusters (h) and correlation of ROS score with Tcf7 expression in terminally exhausted CD8+ T cell clusters (i) from melanoma patients treated with immune checkpoint inhibitors6. P values were calculated by unpaired, two-sided Student’s t-test (a,c), Wilcoxon two-sided rank sum test with Benjamini-Hochberg False Discovery Rate (FDR) correction (h), one-way ANOVA with Sidak’s multiple comparisons post-test (e-f), or based on 1,000 permutations by the GSEA algorithm and not adjusted for multiple comparisons (i). Data are presented as the mean ± s.d. of n=3 (a,e,f) or n=5 (c) biologically independent samples from a representative experiment. **P<0.01, ****P<0.0001.

