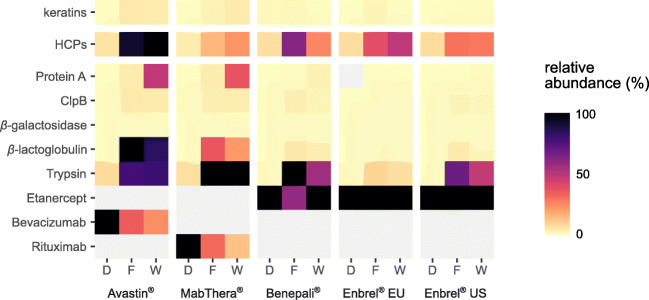
Fig. 3.
Relative protein quantification in the direct workflow (D) and in the flow-through (F) and wash (W) fractions of the depletion workflow for each drug product. Each value was obtained by (1) extracting and integrating precursor ion currents of up to three of the most intense (unique and shared) peptides per protein, (2) averaging these areas, (3) calculating the mean over three technical replicates, and (4) scaling to the maximum value in each column (M) so that all other values in this column are given as percent of the maximum. The two topmost rows show cumulative abundances of all keratins and HCPs, respectively

