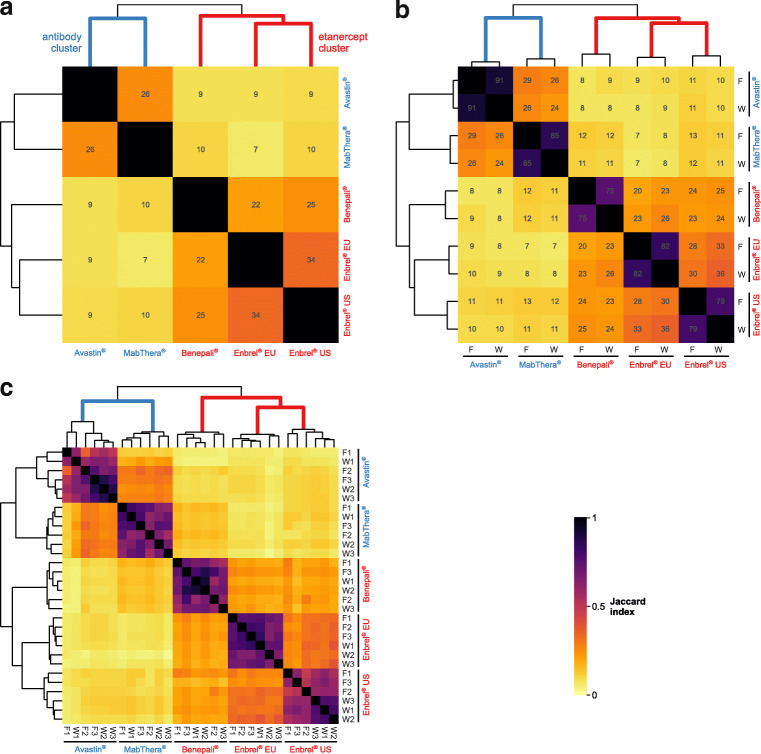
Fig. 5.
Comparison of HCP profiles on the level of (a) DPs, (b) flow-through (F) and wash (W) fractions from the depletion workflow, and (c) replicates 1 to 3 for these fractions. Heatmap colors correspond to Jaccard indices J, whose numerical values (in percent) appear in panels (a) and (b). Dendrograms and derived row and column orders result from hierarchical clustering employing Jaccard distances 1 − J as measure of dissimilarity. Calculation of Jaccard indices involved HCPs irrespective of credibility detection. The antibody and etanercept clusters are highlighted in blue and red, respectively

