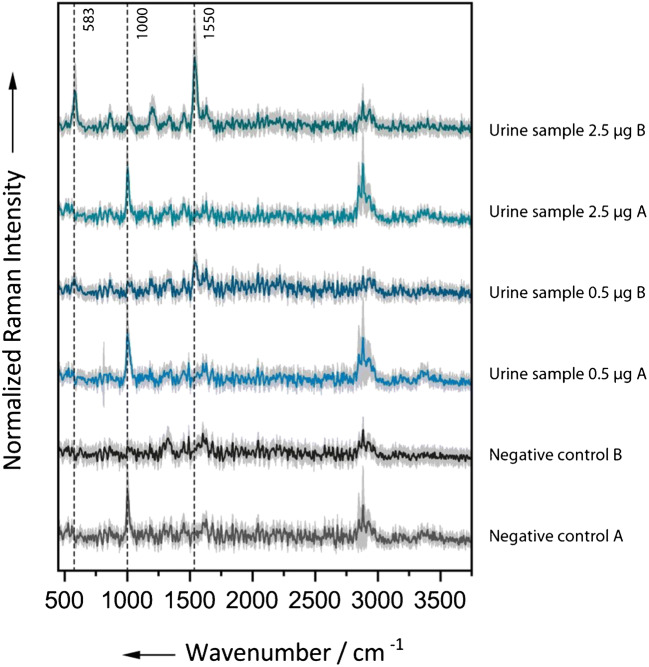
Fig. 3.
Background-corrected Raman spectra with standard deviation from the dried extracts obtained from urine samples with defined amounts of [Fe]TAFC. The spectra of residues from the preextraction step (A) with a chloroform/diethyl ether mixture feature a band at 1000 cm−1 indicating the presence of urea. Marker bands for [Fe]TAFC are only visible in the spectra from the chloroform extraction (B). Accordingly, it can be assumed, that the biomarker is mainly enriched in the pure chloroform phase. The spectra were shifted vertically for clarity

