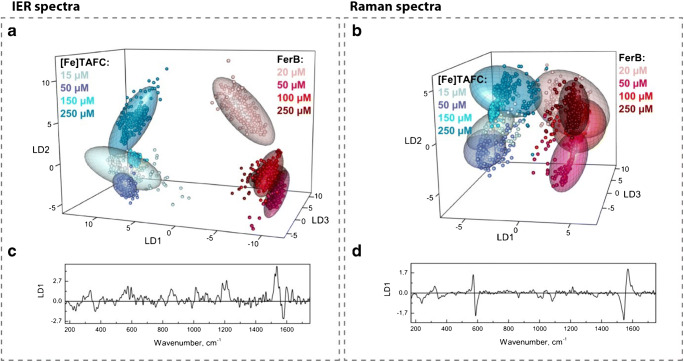
Fig. 4.
Linear discriminant analysis plot and first LDA loading vector showing the differentiation of [Fe]TAFC and FerB by means of their IER spectra (a, c) and Raman spectra (b, d). Independent from the concentration clear separation of two siderophores was achieved. Comparing both techniques, it can be concluded that IER provides a slightly better separation, since the spectra from the two different analytes are further apart in LDA space. Differentiation is mainly based on the shift of the Raman band around 1550 cm−1

