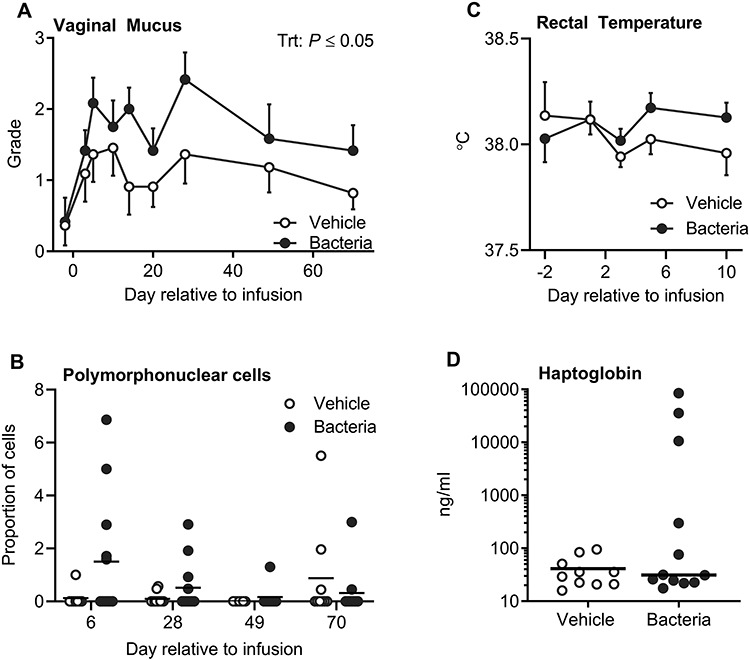
Figure 2.

Establishment and quantification of uterine disease. Vaginal mucus (A) was collected and graded on a scale of 0 to 4 based on the presence of mucopurulent discharge. Data are the mean grade ± SEM. The proportion of polymorphonuclear cells in cytological samples (B) was assessed in a total of 200 cells per cow. Each dot represents a cow and the solid line represents the mean. Rectal temperatures (C) are displayed as mean ± SEM. Plasma haptoglobin (D) was evaluated on day 5 relative to infusion, and each dot represents an individual cow and the solid line represents the mean.
