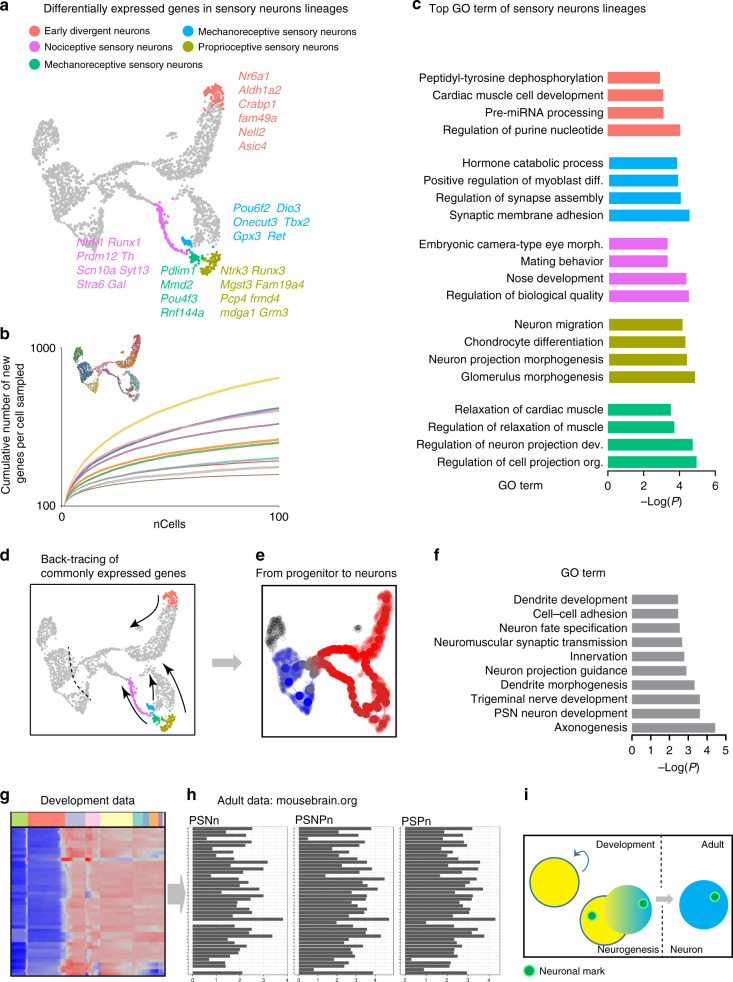
Fig. 6. Transcriptional identity of the major subtypes at neuronal endpoints.
a Analysis of endpoints trajectories identifies differentially expressed genes in the distinct sensory lineages. b Bootstrapping analysis detects a decrease in the number of unique genes as the cells progress towards differentiated states along the diversification tree, with the endpoints clusters having the lowest heterogeneity among all clusters. c GO terms of the sensory lineages show redundancy of the categories between the subtypes of neurons. d–f Gene transmission from progenitor cell to daughter neurons was studied by first identification of the common genes at the trajectories’ endpoints and second by back-tracking those modules of genes in time up to the cycling neuronal progenitors (d). We identified 43 genes being already expressed by the progenitor population; those genes belong to GO term categories in (f) and are all related to neuronal processes. g, h Pseudotime of the 43 identified genes during development (g, clusters color code is similar to Fig. 1c) and still expressed in the adult DRG neurons (h) composed of the three sub-taxons: peripheral sensory neurofilament neurons (PSNn), peripheral sensory non-peptidergic neurons (PSNPn) and peripheral sensory peptidergic neurons (PSPn) (data from mousebrain.org). Note one line in (g) and (h) represent one same gene. The genes list is provided in the Source Data file. i Scheme showing the ID neuronal mark pass on by mitotic mother cell to daughter neurons and kept into adulthood.

