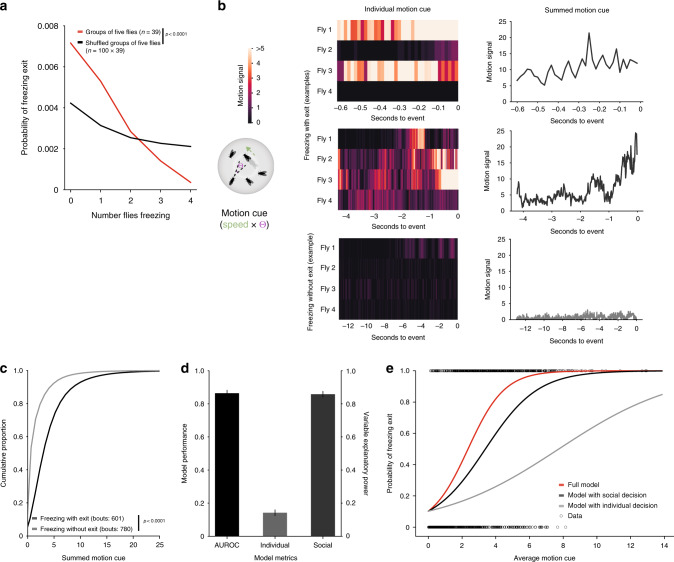
Fig. 3. The group effect on individual freezing exit.
a Probability of freezing exit at time t as a function of the number of flies freezing at time t−1 (see methods). P-value results from χ2 contingency test (G-test). b The motion cue is formalized as the other fly’s speed multiplied by the angle (θ) it produces on the retina of the focal fly (schematic). Representative examples of the motion cue starting in the 500 ms bin after looming offset for a focal fly until freezing exit or the end of the inter-looming interval (without freezing exit): heatmaps show the individual motion cues for each of the four surrounding flies and the line graphs show the summed motion cue of these four flies. c Cumulative distributions of the summed motion cues (x axis cut at motion cue = 25). P-value results from Kolmogorov–Smirnov test. d, e Logistic regression model of the decision to stop or continue freezing as a function of individual and social decision processes (10,000 bootstrapping events). d Mean and standard deviation of model performance (AUROC – area under the receiver operating characteristic curve, black) and explanatory power of the individual (light gray) and social processes (dark gray). e Binary freezing data and average logistic predictive probabilities using individual and social coefficients alone or combined as a function of the average motion cue.

