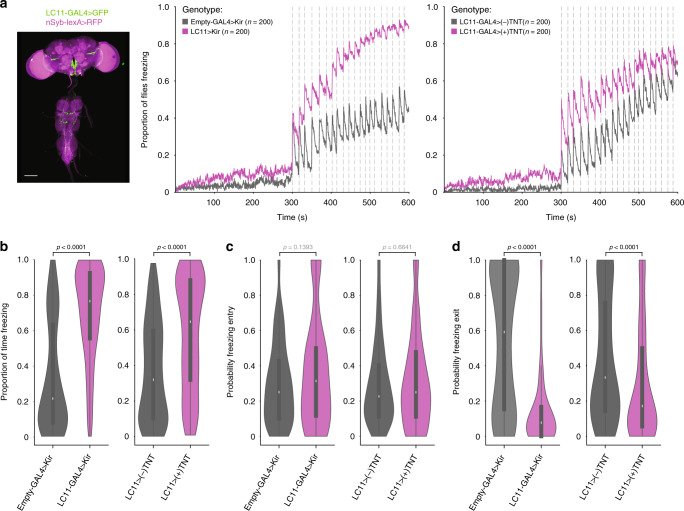
Fig. 5. Manipulating lobula columnar neurons 11 (LC11).
a Anatomy (scale bar, 100 μm) and proportion of flies freezing throughout the experiment in groups of five, for LC11-GAL4 > Kir2.1 and LC11-GAL4 > (+)TNT depicted in purple and controls (gray). b–d Violin plots representing the probability density distribution of individual fly data bound to the range of possible values, with boxplots (elements: center line, median; box limits, upper (75) and lower (25) quartiles; and whiskers, 1.5× interquartile range). b Proportion of time spent freezing throughout the experiment. c Probability of freezing entry after looming presentation. d Probability of freezing exit before the following looming stimulus. P-values result from two-tailed Mann–Whitney test.

